


IAMMETER's Energy Consumption Analysis menu contains five reports for reviewing hourly patterns, selected time windows, different meters, different periods and monthly summaries.
This guide explains which report to choose, how to set its comparison scope and how to interpret the result.
New to energy analysis? First read How to Analyze Home Electricity Consumption and Find Energy Waste for baseline, base-load, peak-demand and before/after analysis methods.
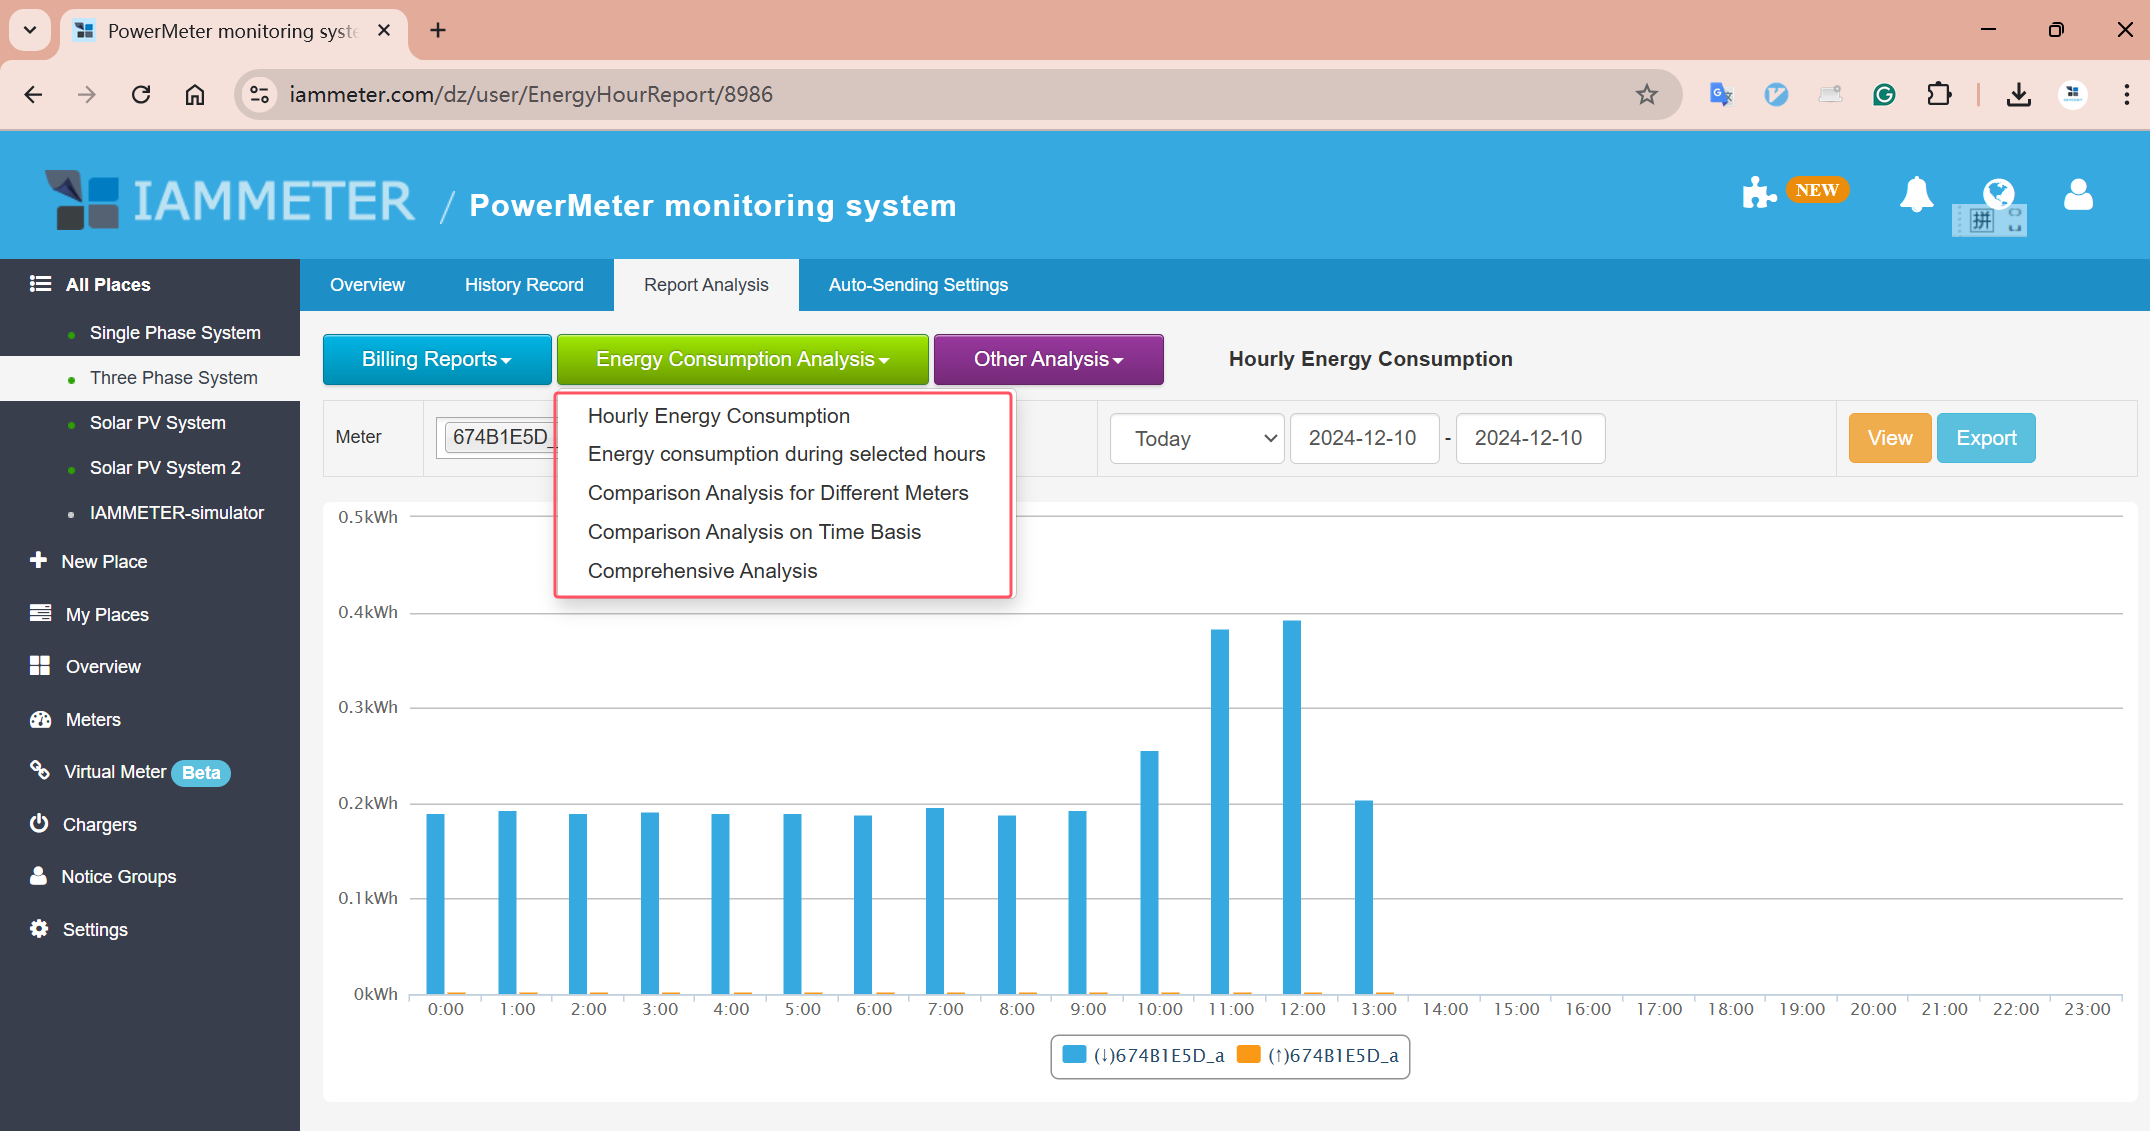
The available reports are:
| Report | Use it when you need to |
|---|---|
| Hourly Energy Consumption | See how energy is distributed across the 24 hours of a day |
| Energy Consumption During Selected Hours | Compare user-defined time windows, shifts or tariff periods |
| Comparison Analysis for Different Meters | Compare measurement points over the same period |
| Comparison Analysis on Time Basis | Compare one measurement point across different periods |
| Comprehensive Analysis | Review natural-month totals and trends |
The report result represents the selected measurement boundary. Before comparing data, confirm what each selection measures.
Examples:
Do not compare two series as if they measure the same thing unless their CT positions and channel roles are understood.
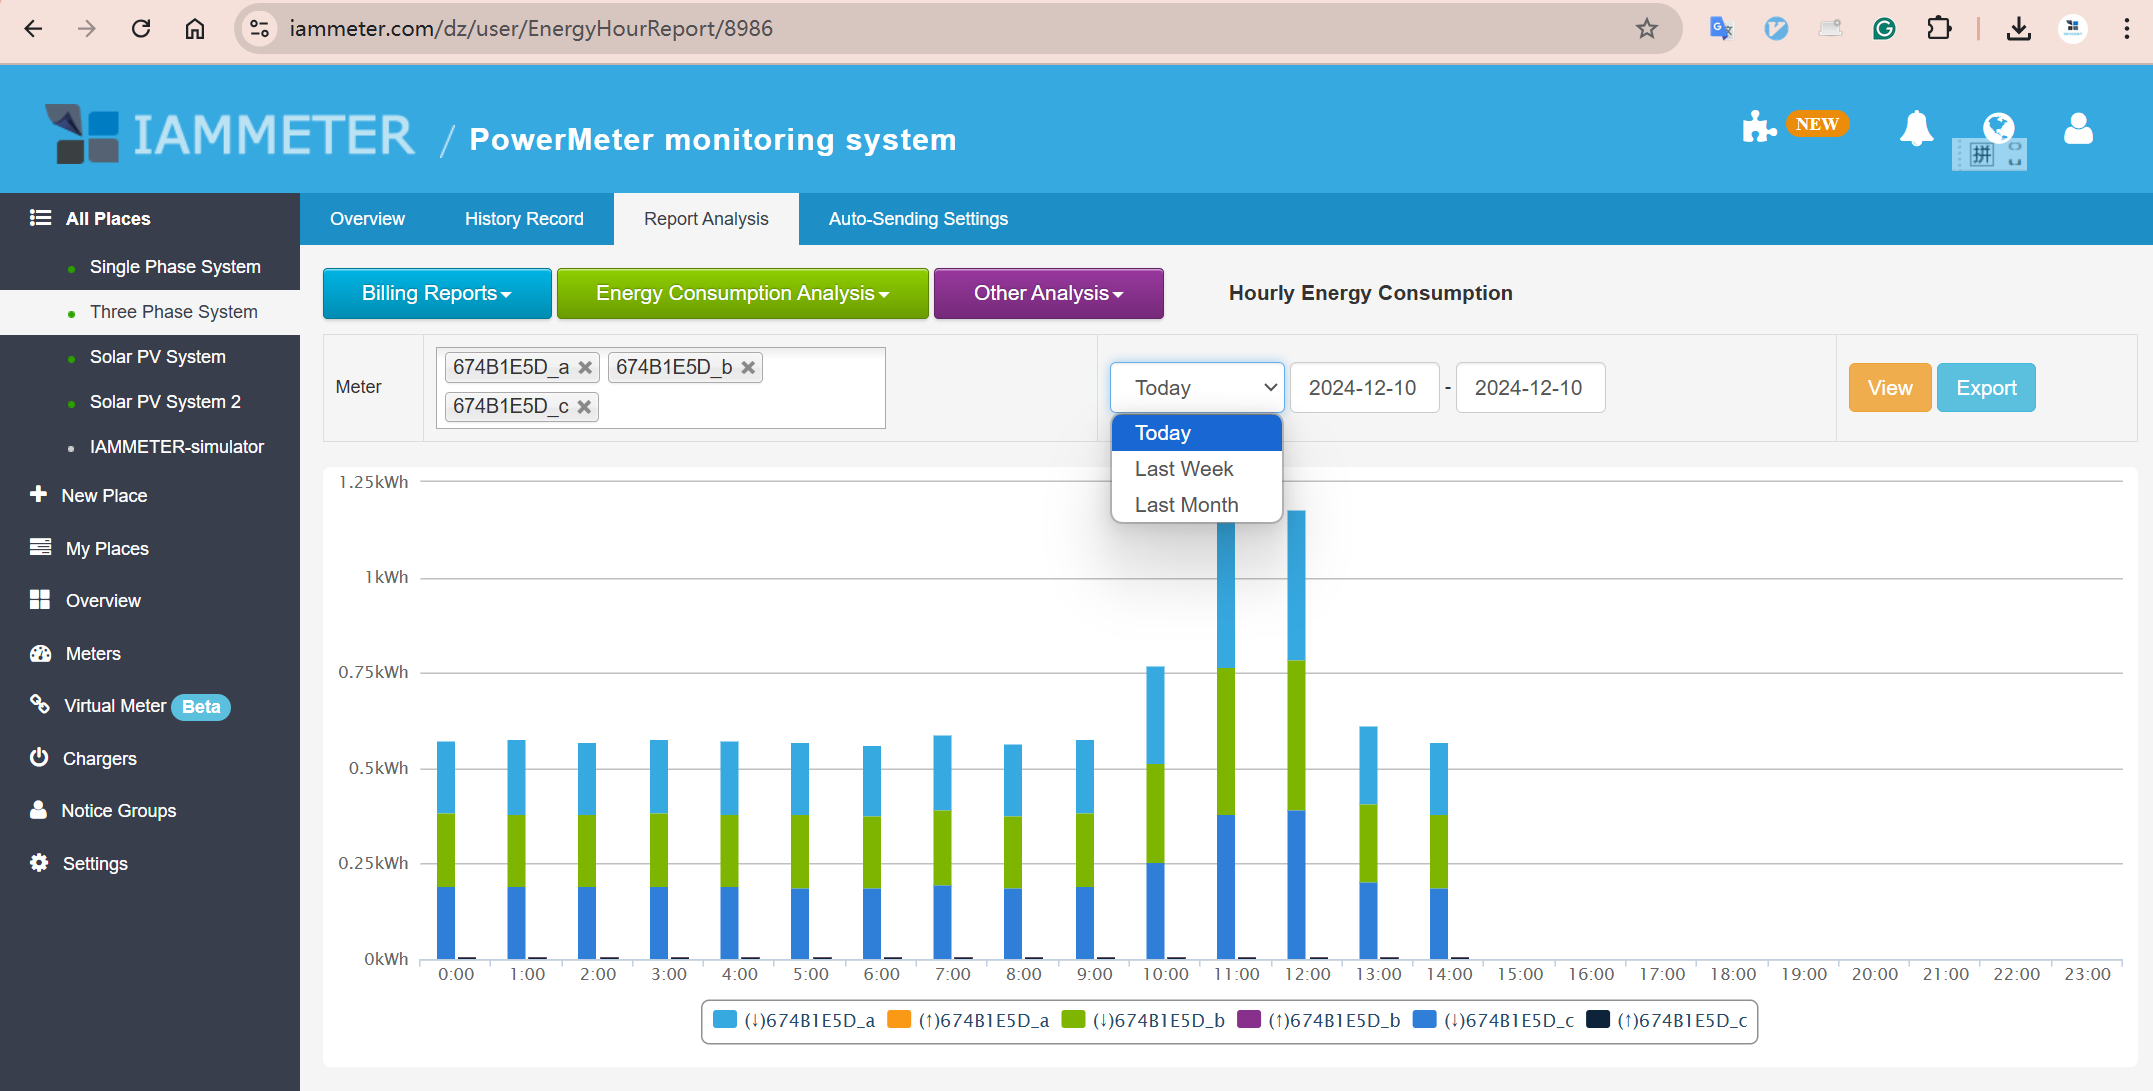
Use Hourly Energy Consumption to display energy for each hour from 00:00 through 23:00.
Use this report when the standard 24-hour chart is too broad and you need to compare specific groups of hours.
Residential examples include:
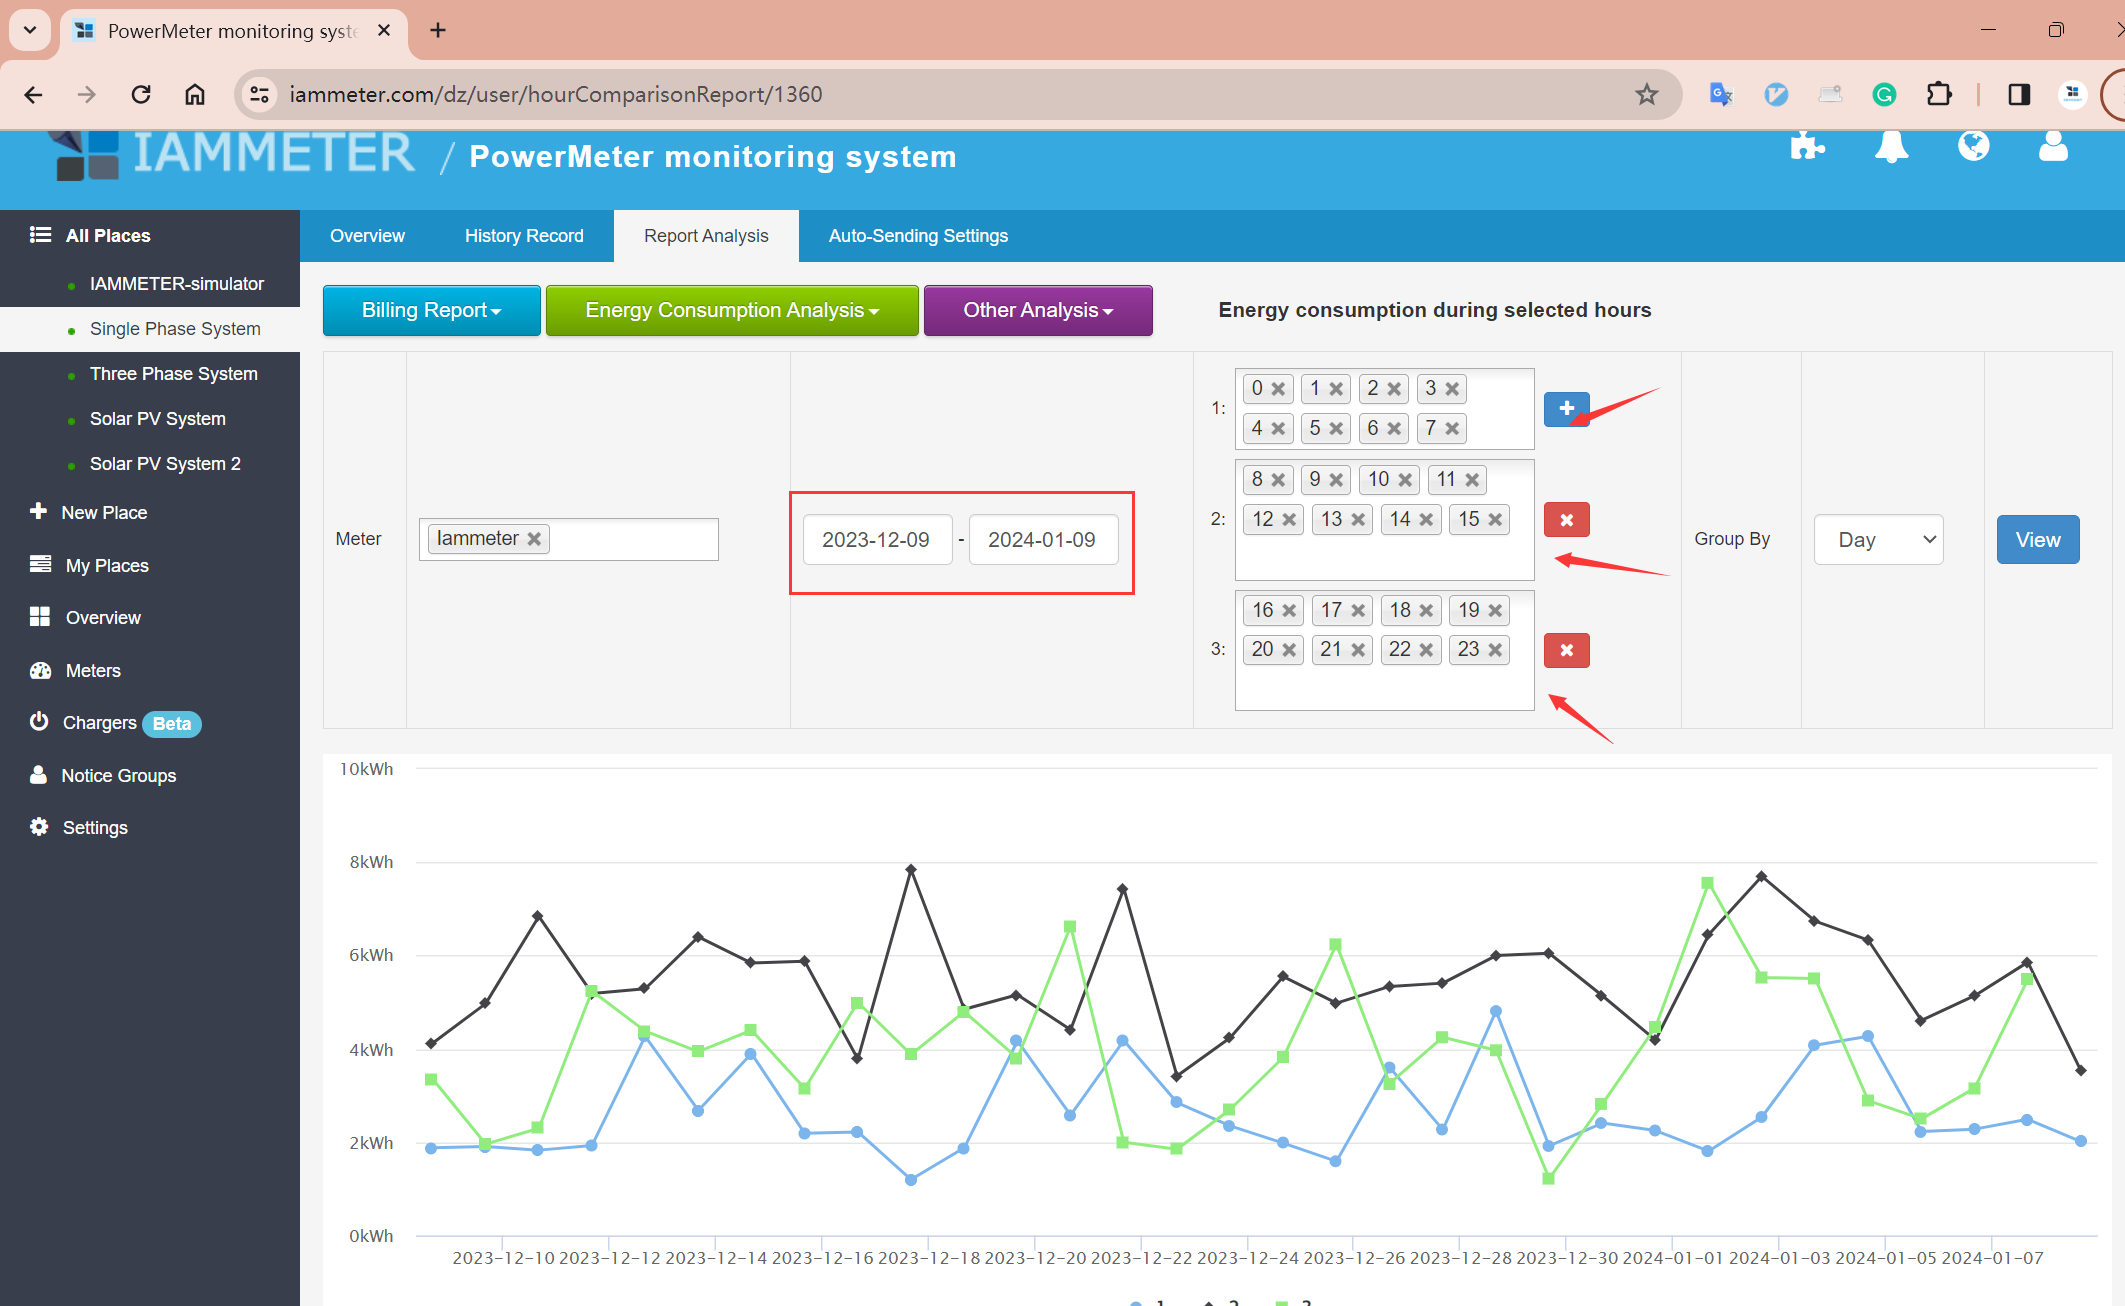
Each plotted series represents one configured group of hours. Compare the groups over the same dates to see how much energy was used in each time window.
For a time-of-use tariff comparison, define the groups so they match the utility tariff periods exactly. If a tariff crosses midnight, check that every hour is assigned to the intended group.
Use this report to compare different meters or measurement points over the same period.
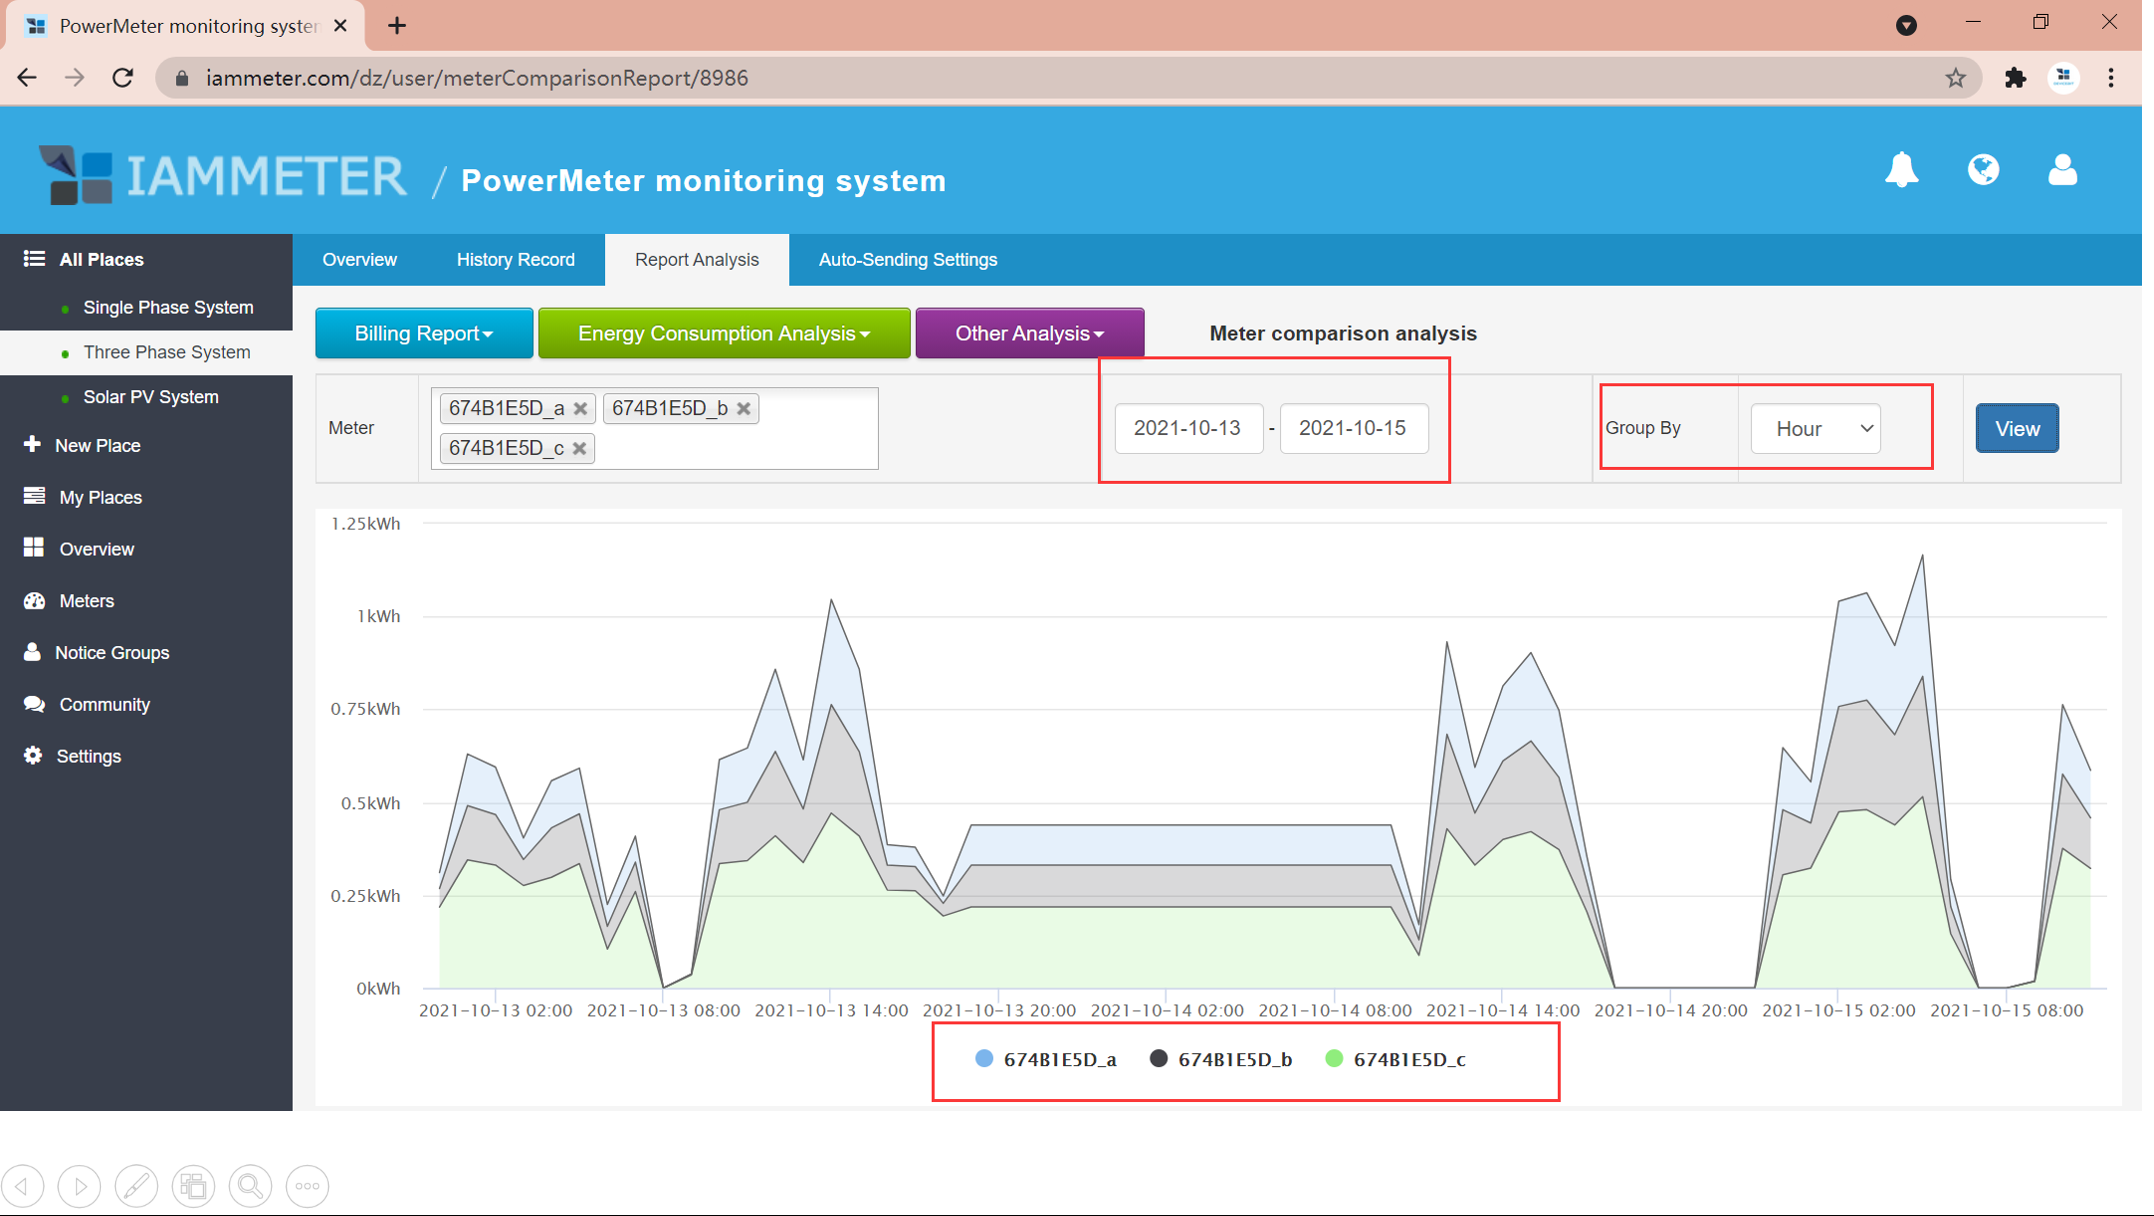
Valid examples include:
Avoid adding a dedicated-circuit reading to a whole-home reading when that circuit is already included in the whole-home total.
Before concluding that one meter uses more energy, also check:
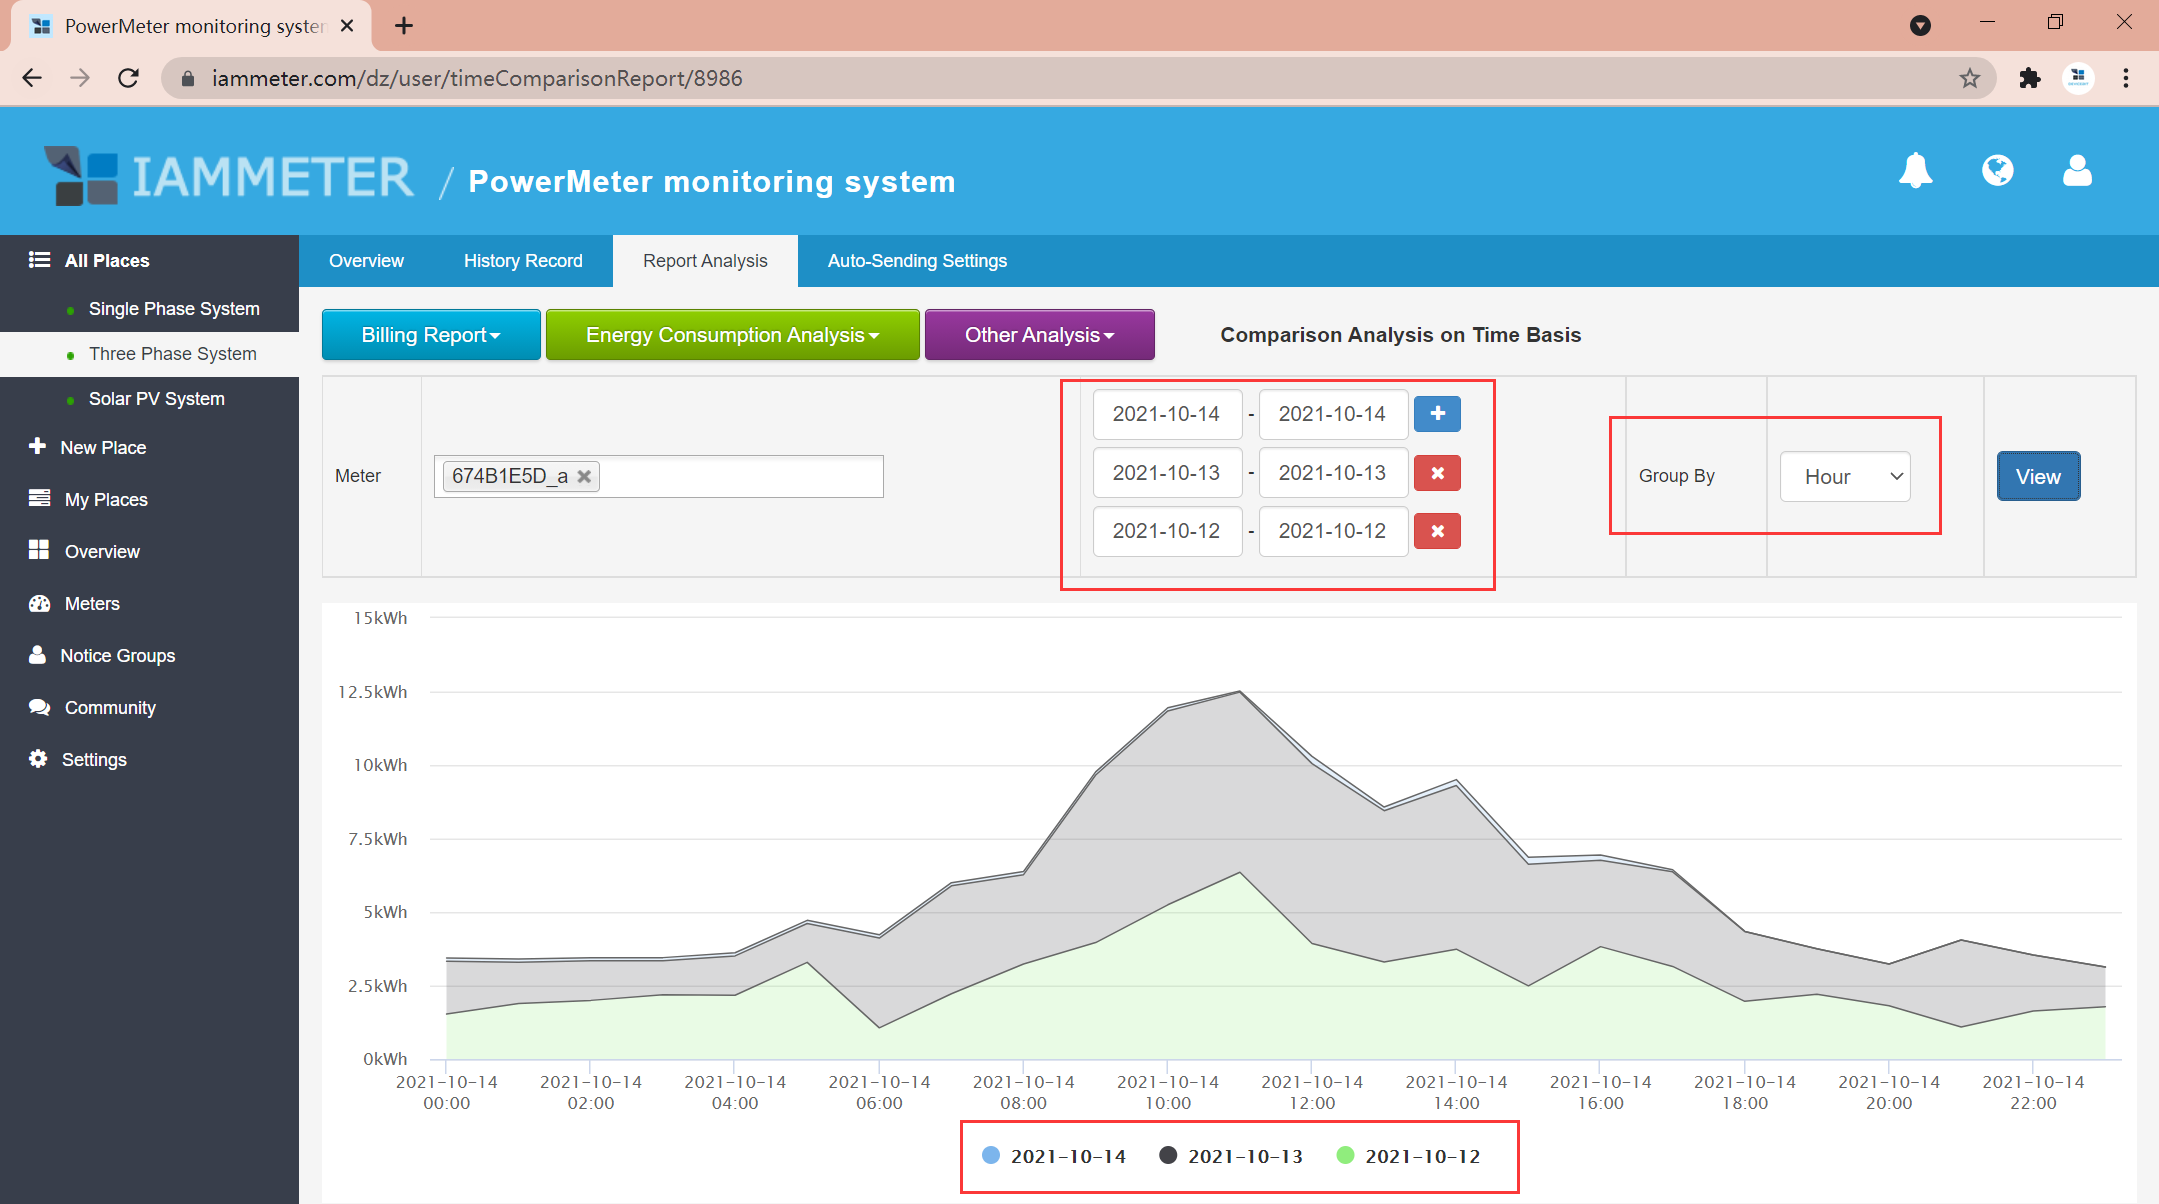
Use this report to compare the same meter across different dates or periods.
It supports comparisons such as:
Hourly comparison across different days
Daily comparison across different months
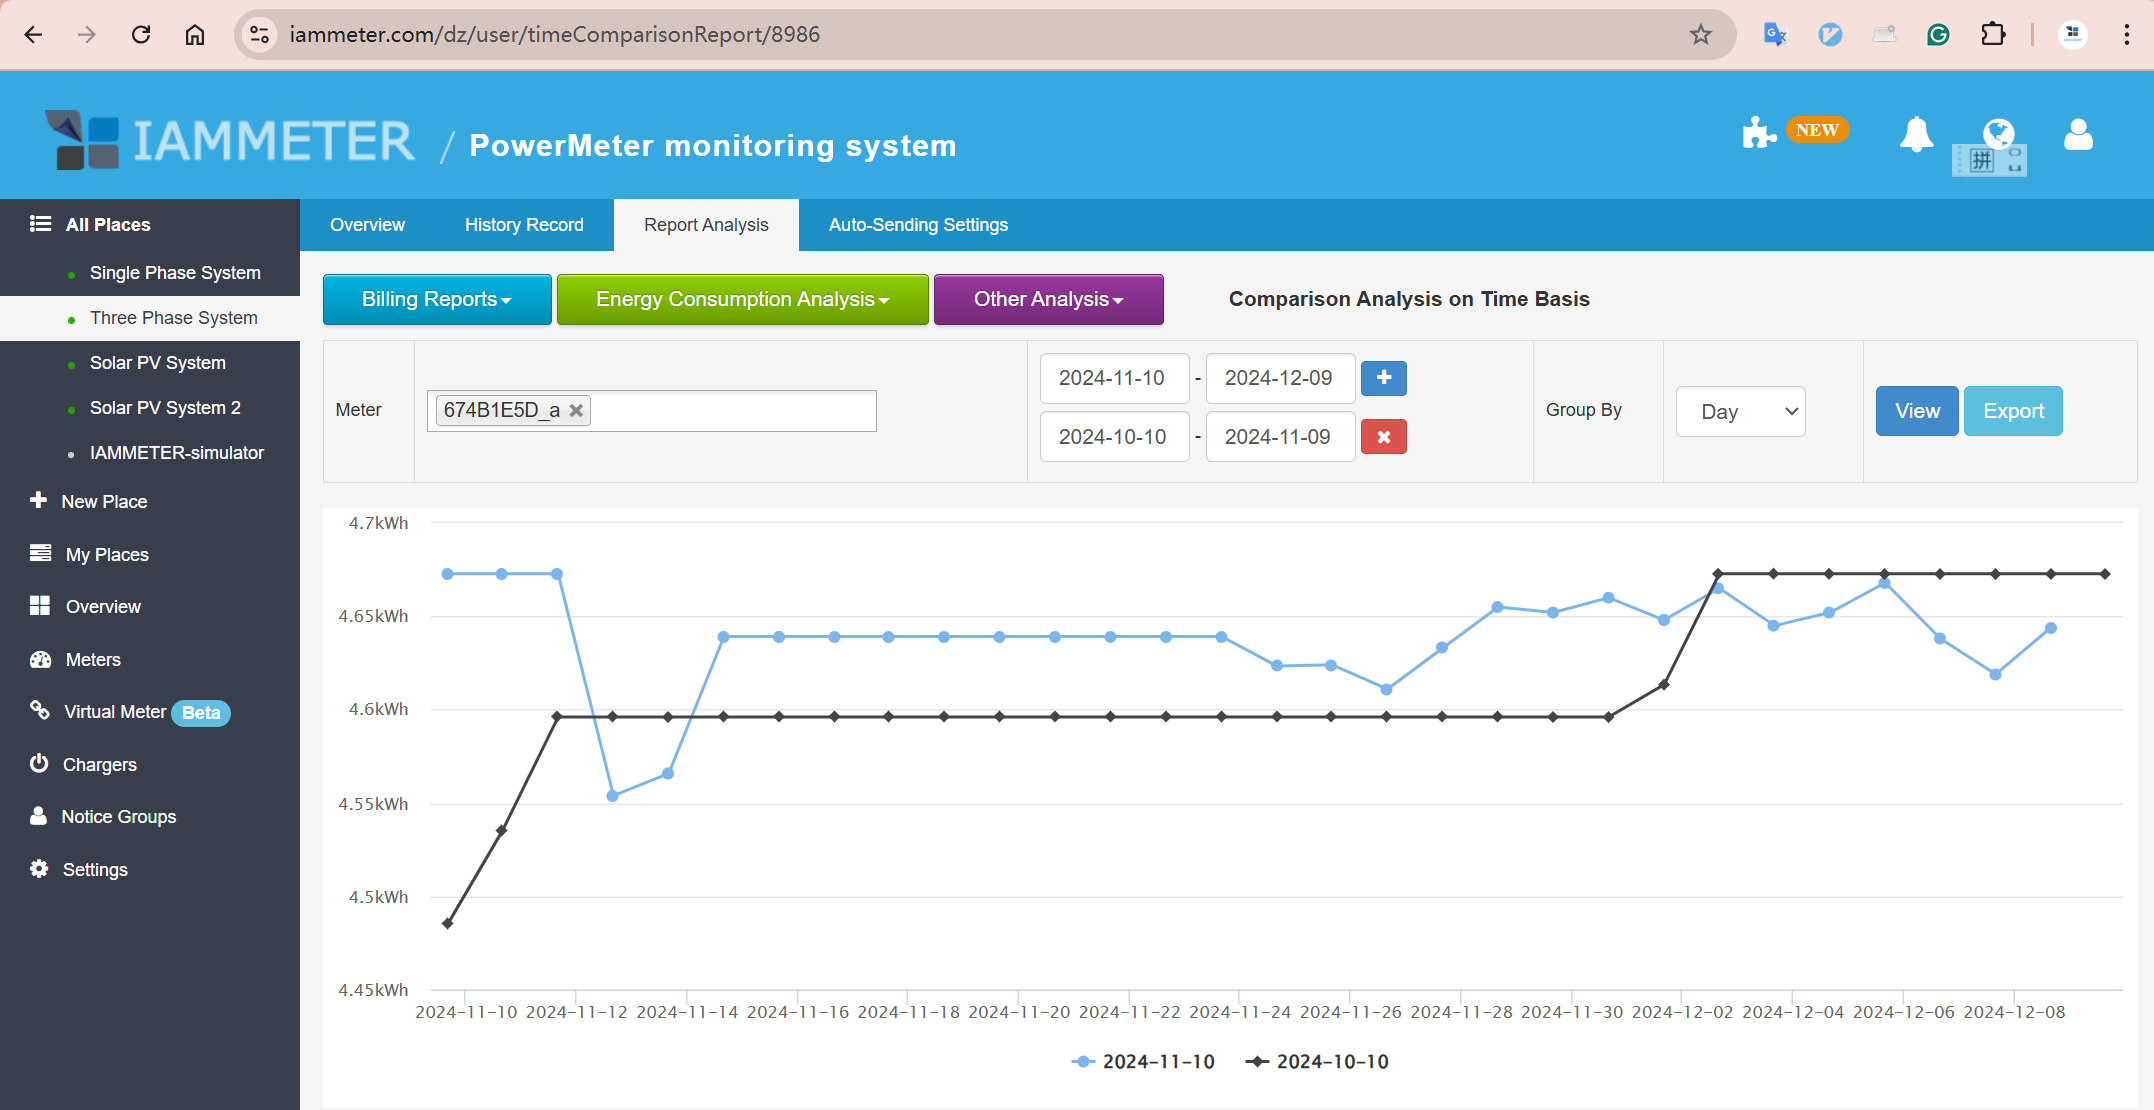
For a valid before/after comparison:
If equal periods are not possible, compare an average such as kWh per day rather than raw totals.
Use Comprehensive Analysis for a consolidated view based on natural months.
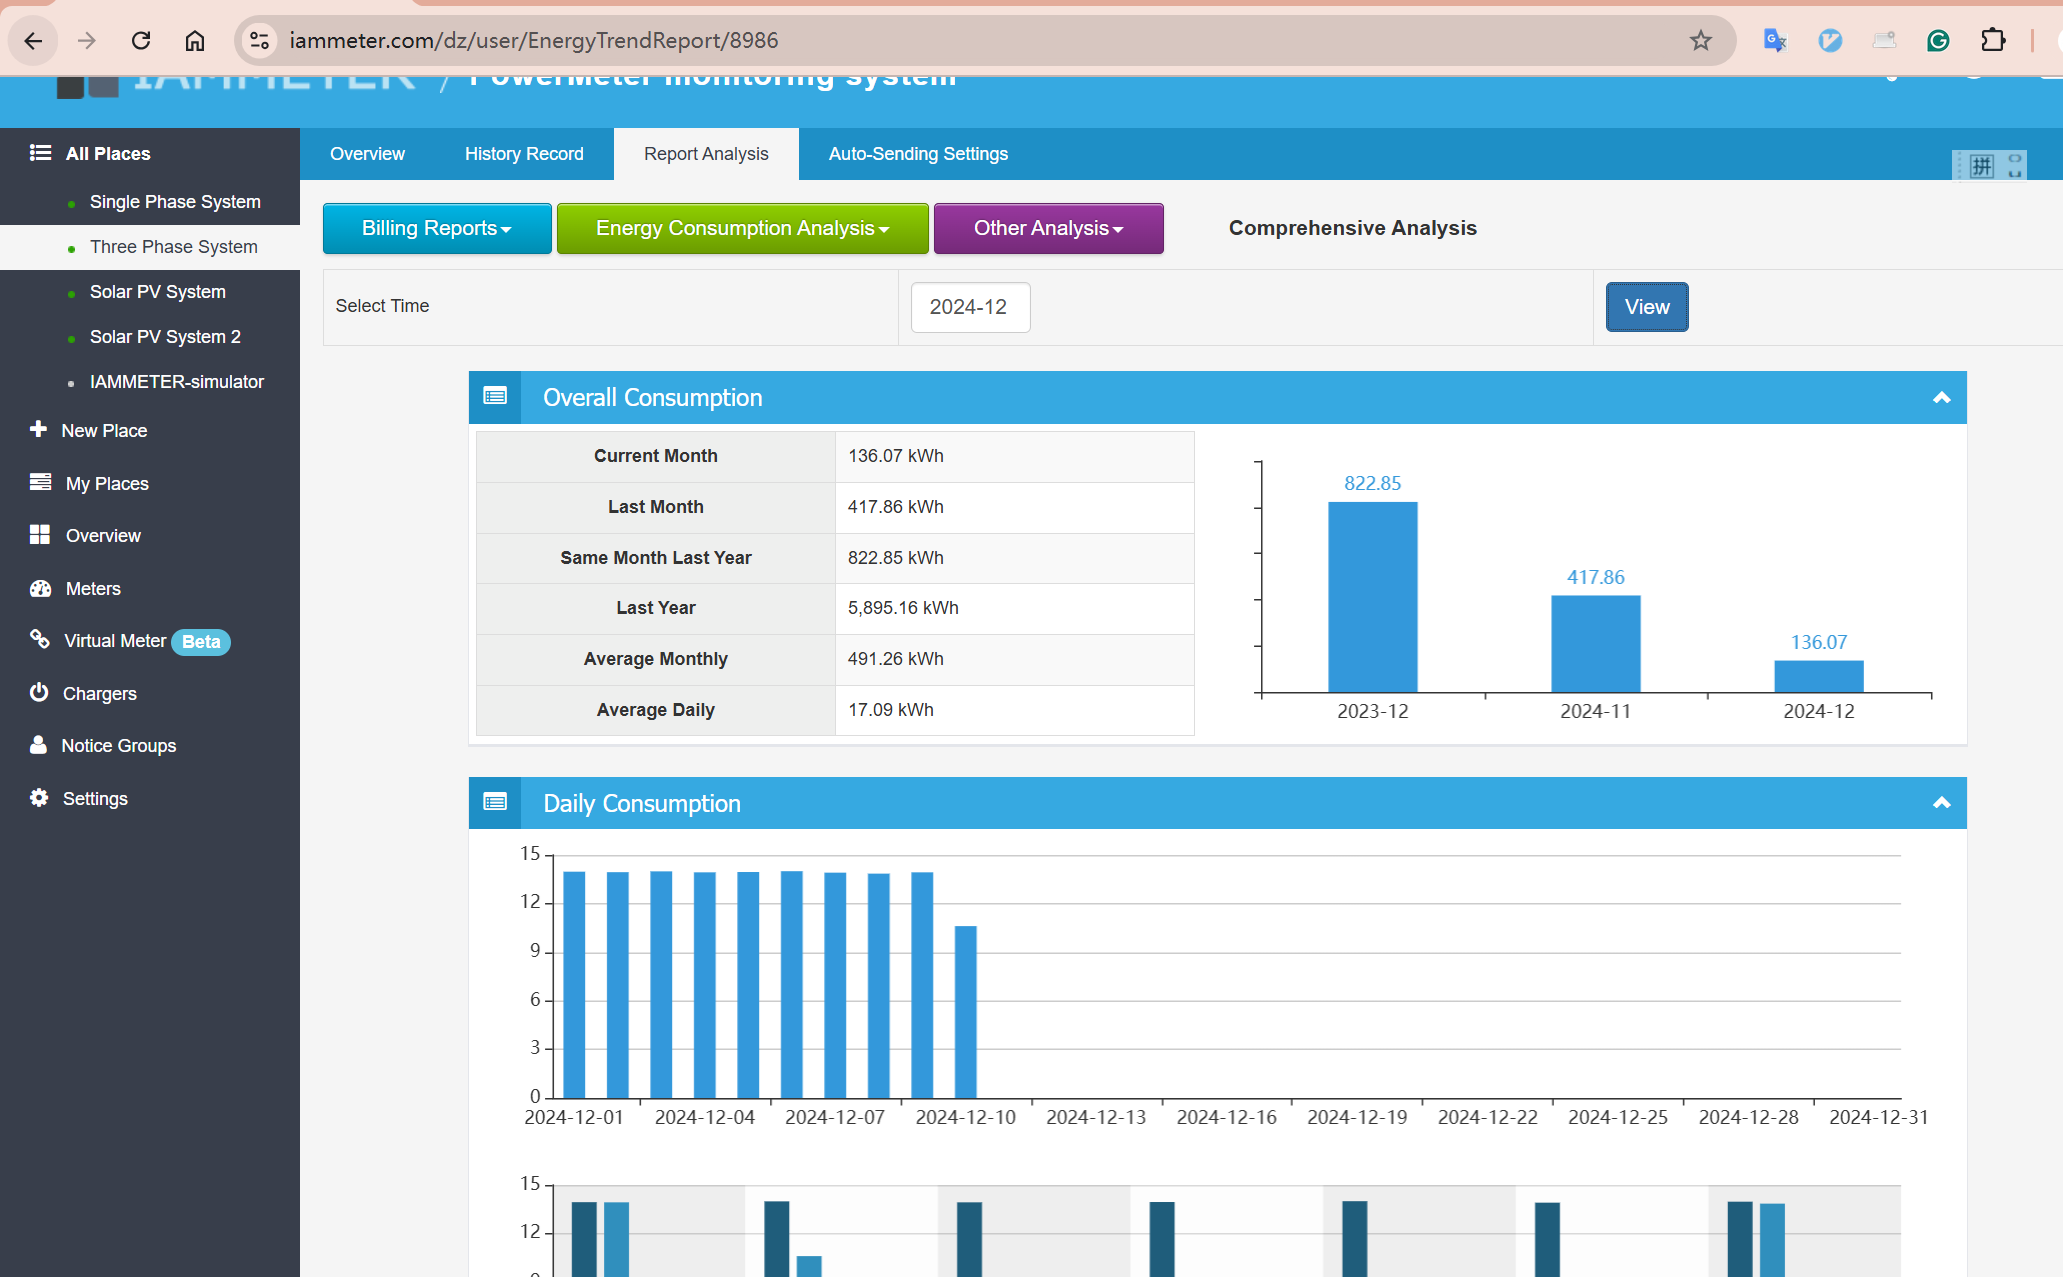
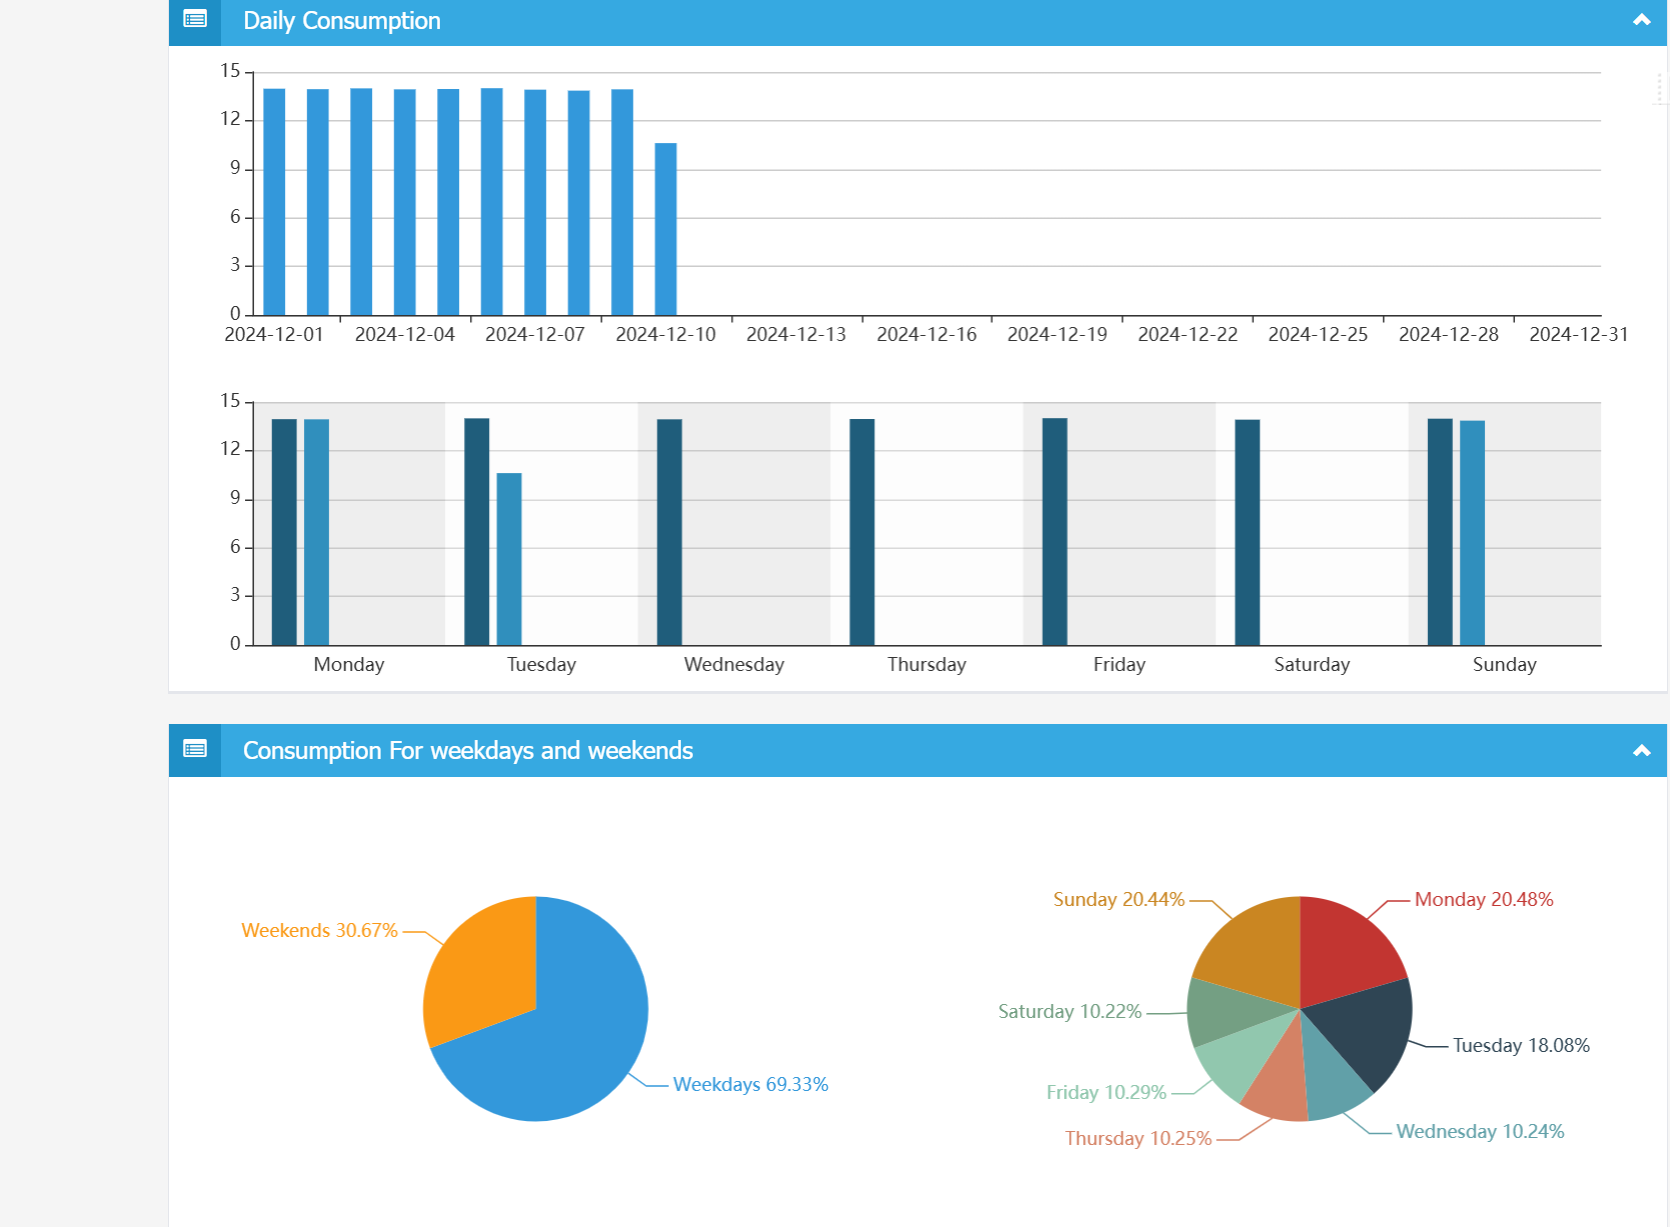
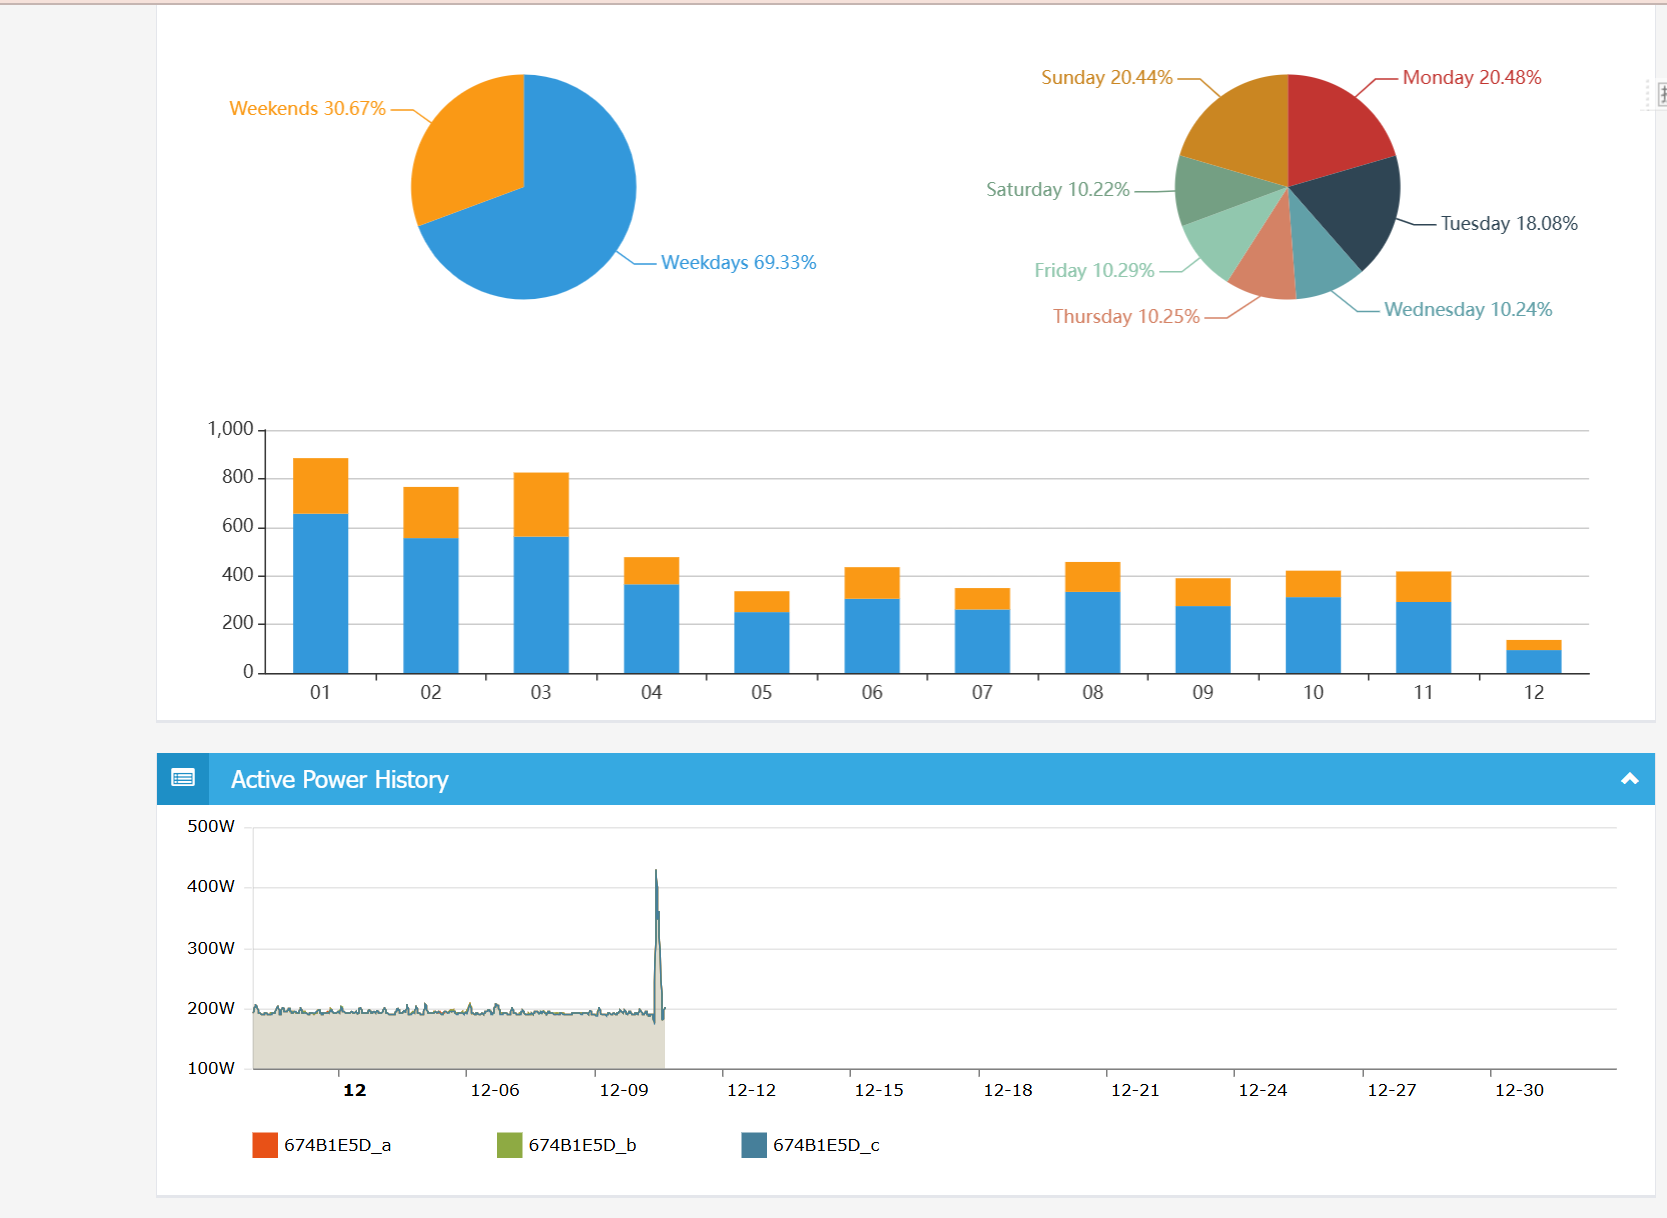
Use this report to review the longer-term direction of energy consumption. Because it uses natural months, do not assume that its totals correspond exactly to a utility billing cycle that begins on another date.
For utility-bill periods, use the relevant Billing Report and configure the correct billing date.
Some reports display more than one series for the selected meter.
Before reading the chart:
For a solar installation, use the channel roles defined by the system wiring and configuration. See the Home Solar Monitoring Solution for the relationship between inverter generation, grid exchange and calculated home consumption.
When an Export option is available, export the selected report after confirming the meter, date range and interval.
For a repeatable analysis record, save:
This information makes it possible to reproduce the comparison later.
| Problem | Cause | Correction |
|---|---|---|
| Weekly/monthly hourly values appear lower than expected totals | The chart represents the aggregated hourly pattern, not one cumulative monthly bar | Interpret each hour using the report interval definition |
| Two meters cannot be compared meaningfully | They measure different boundaries | Confirm CT positions and channel roles |
| Before/after totals differ mainly because one period is longer | Unequal date ranges | Use equal periods or kWh per day |
| Selected-hour groups do not match the tariff | Missing or incorrectly assigned hours | Rebuild groups from the utility tariff schedule |
| Whole-home plus circuit total is too high | The circuit is already included in the whole-home total | Compare the circuit as a component; do not add it again |
| Natural-month report does not match the bill | Utility billing cycle starts on a different date | Use Billing Reports with the configured billing date |
| Solar chart is interpreted incorrectly | Import, export or inverter channels were confused | Check the legend, channel role and wiring topology |
Choose the report based on the comparison you need: hours within a day, selected time windows, different meters, different periods or a natural-month summary.
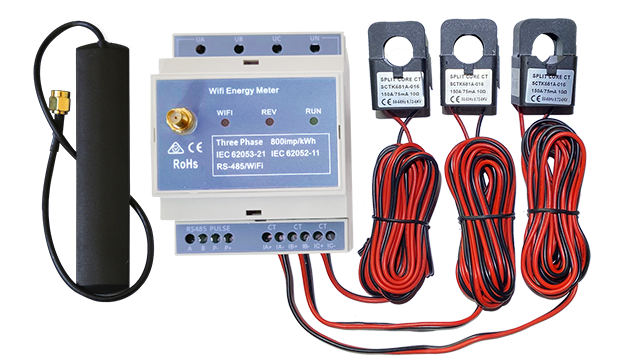
Three Phase Wi-Fi Energy Meter (WEM3080T)
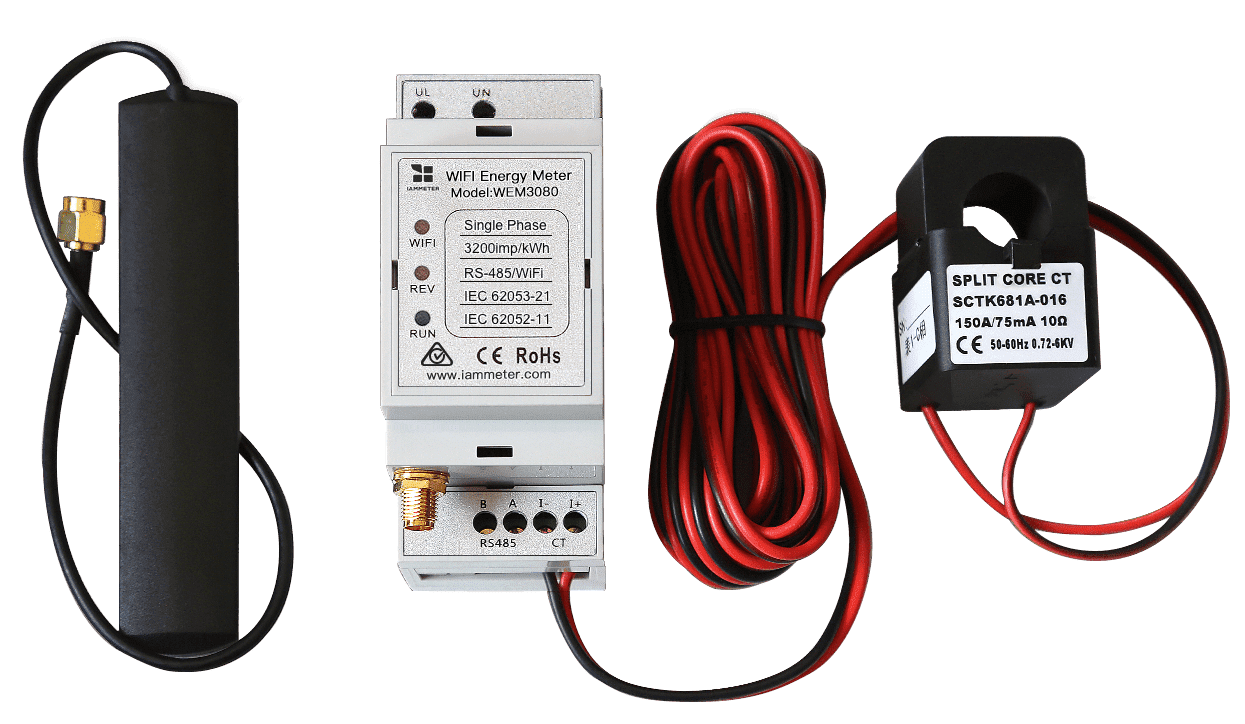
Single Phase Wi-Fi Energy Meter (WEM3080)
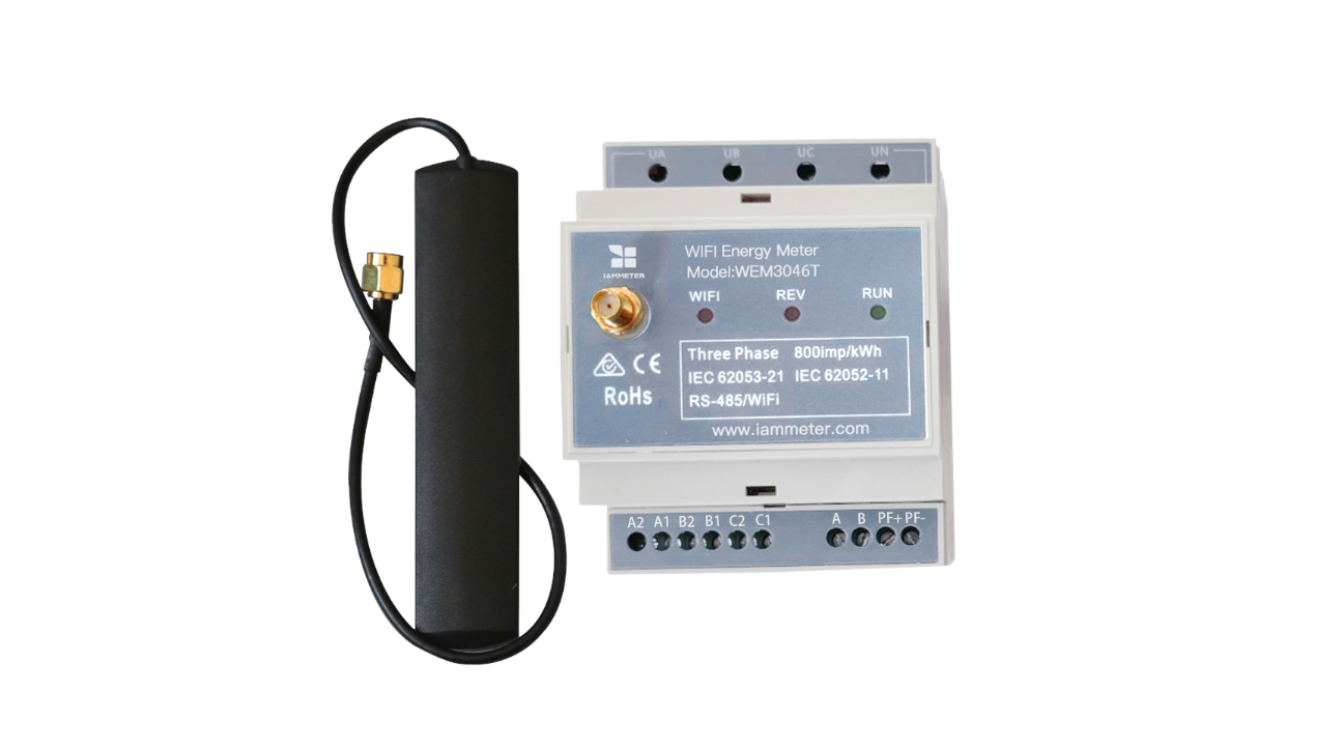
Three Phase Wi-Fi Energy Meter (WEM3046T)
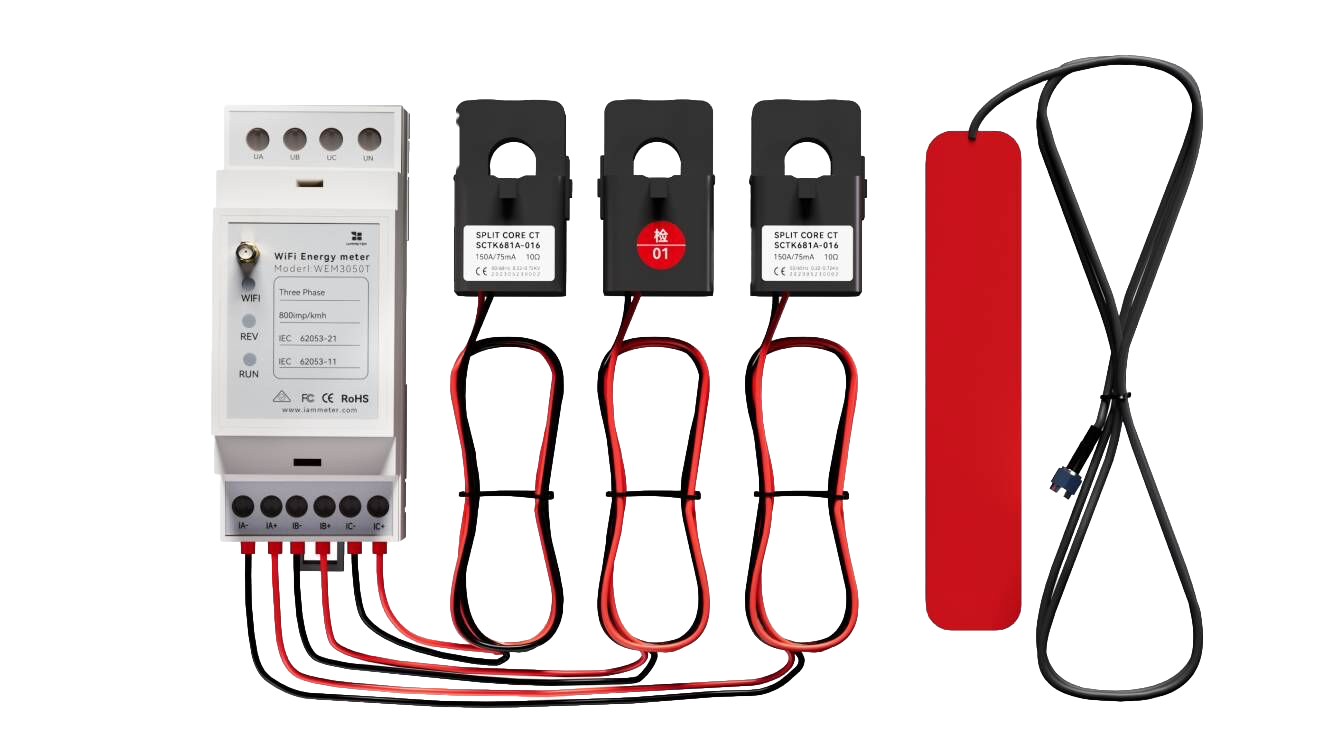
Three Phase Wi-Fi Energy Meter (WEM3050T)