


Monitor and analyze multiple energy sites in one unified view 📘 Official Documentation 🎥 Feature Demo Video
Virtual Site is an advanced data aggregation and analysis feature in IAMMETER-Cloud. It allows you to group multiple monitored places (sites) into a tree structure, providing an upper-level overview of your total energy usage, solar generation, and billing data.
This is especially useful when you manage:
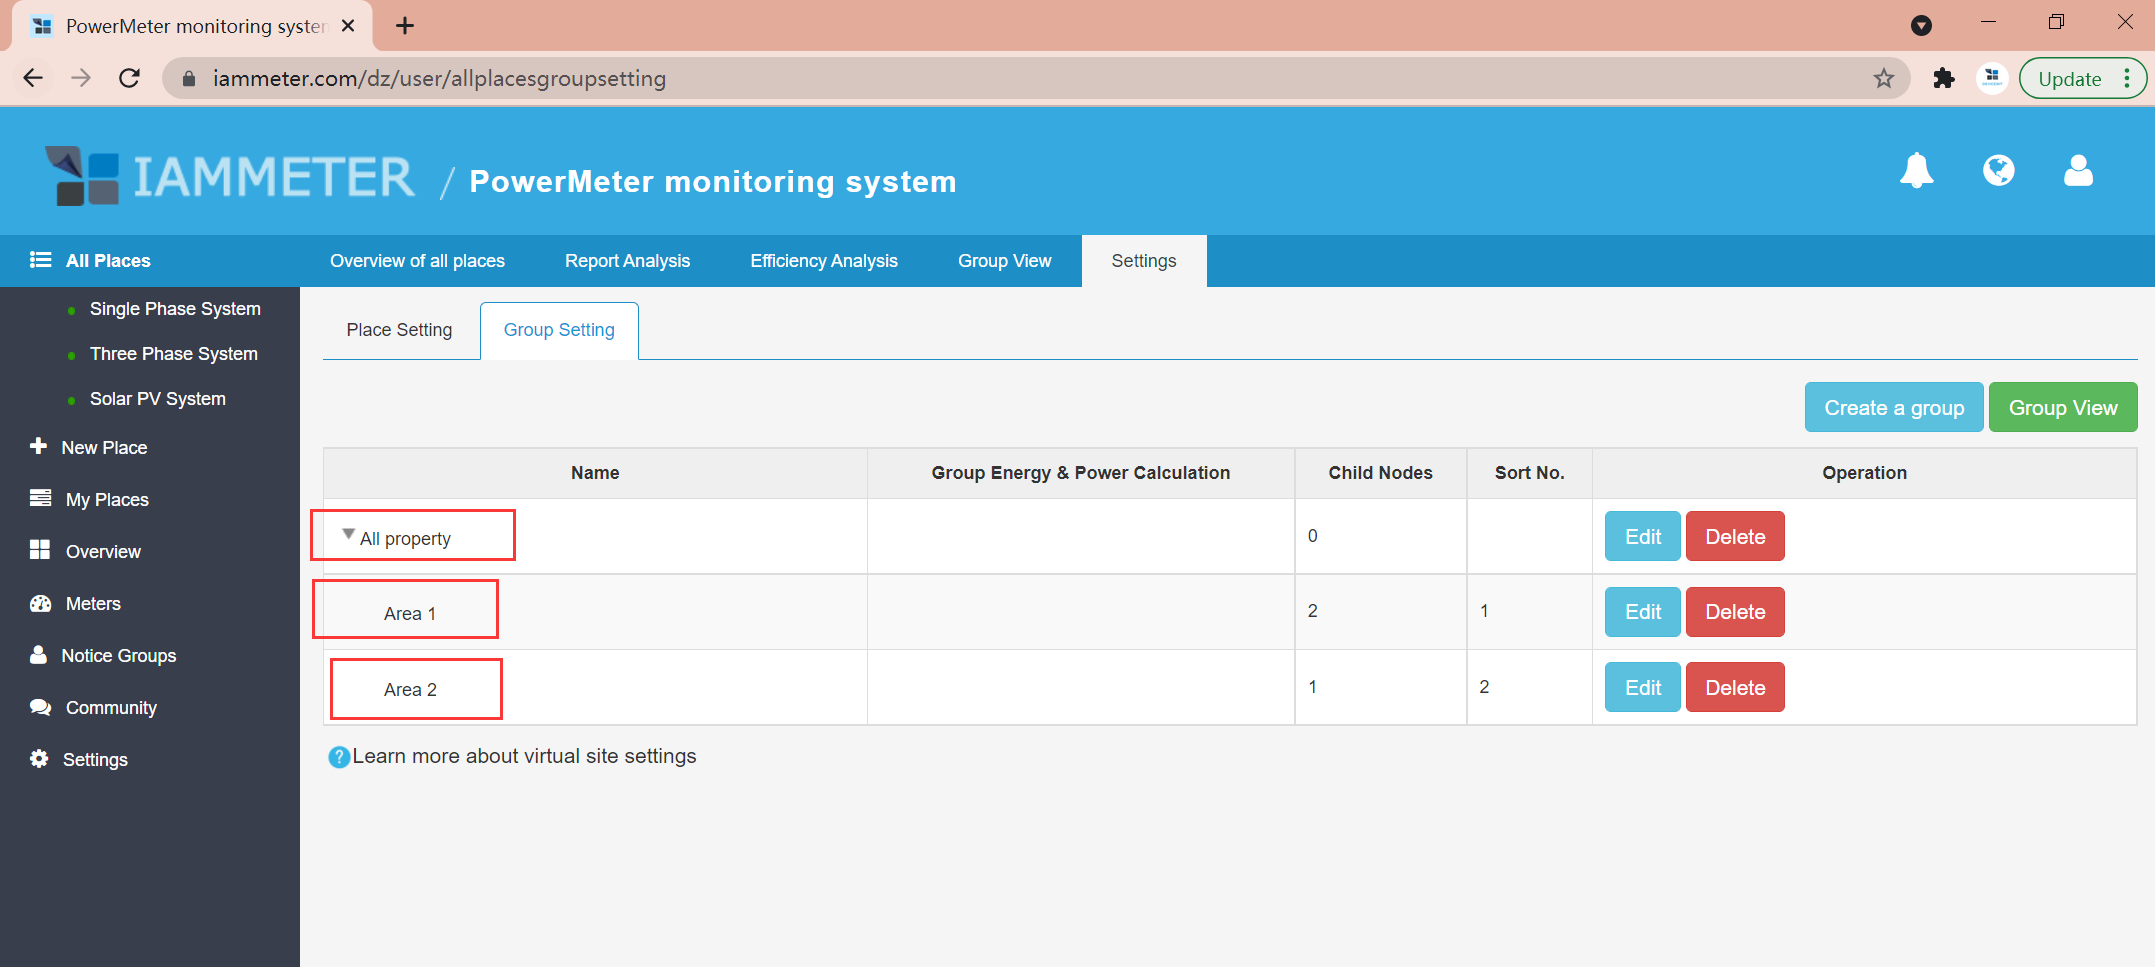
Concept: A Virtual Site acts as a “parent site” that combines data from multiple Places.
Example hierarchy:
Headquarters (Parent Node)
├── Office Building (Child)
├── Dormitory (Child)
└── Factory (Child)
The platform automatically aggregates all energy consumption, solar generation, and cost data across this structure.
| Feature | Description |
|---|---|
| Multi-site aggregation | Combine multiple sites into one virtual site for unified monitoring. |
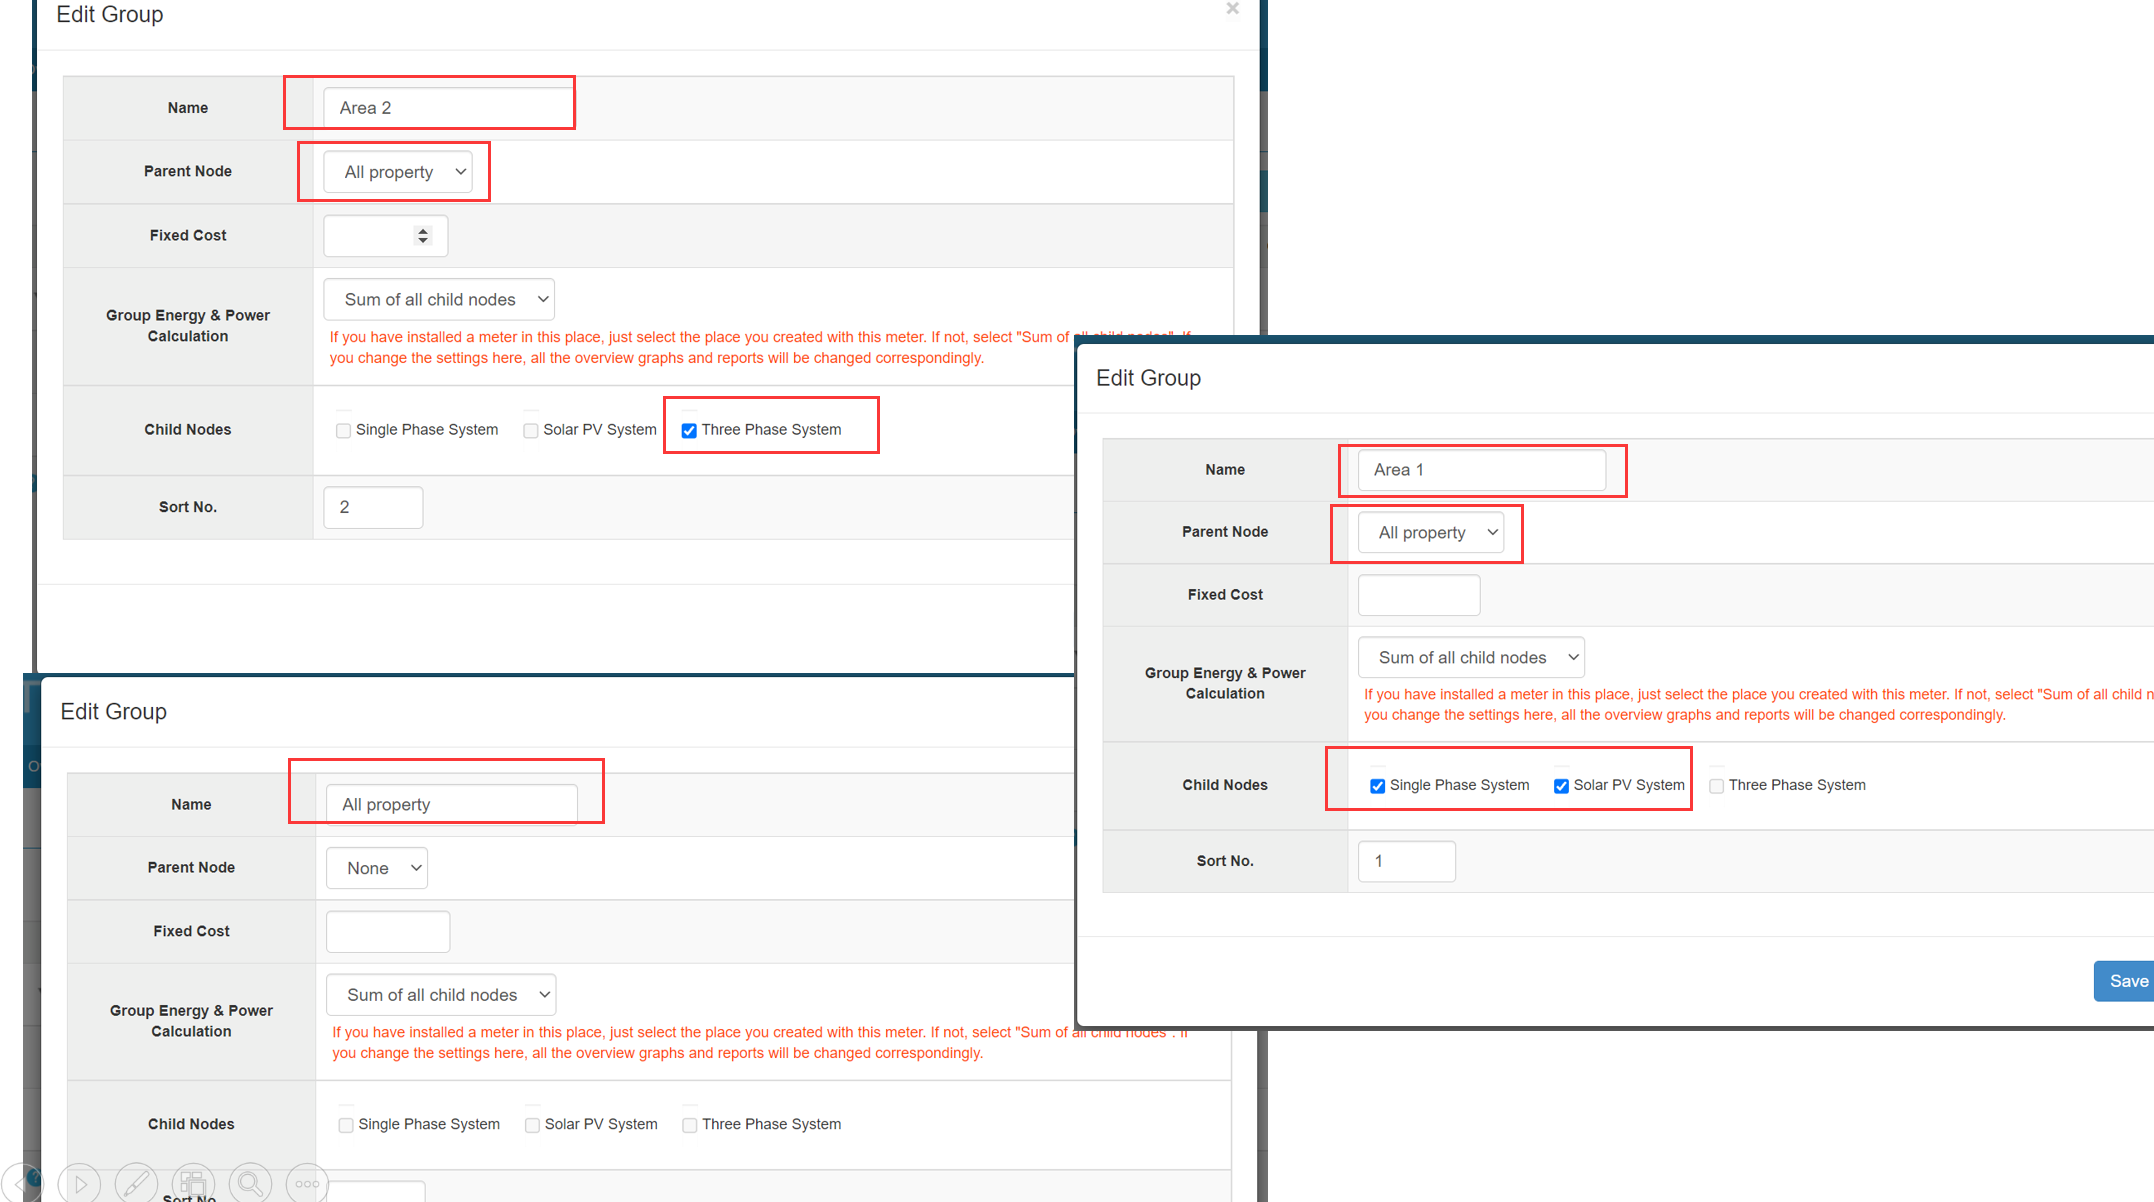
| Tree structure management | Define parent-child relationships to match your real-world hierarchy. |
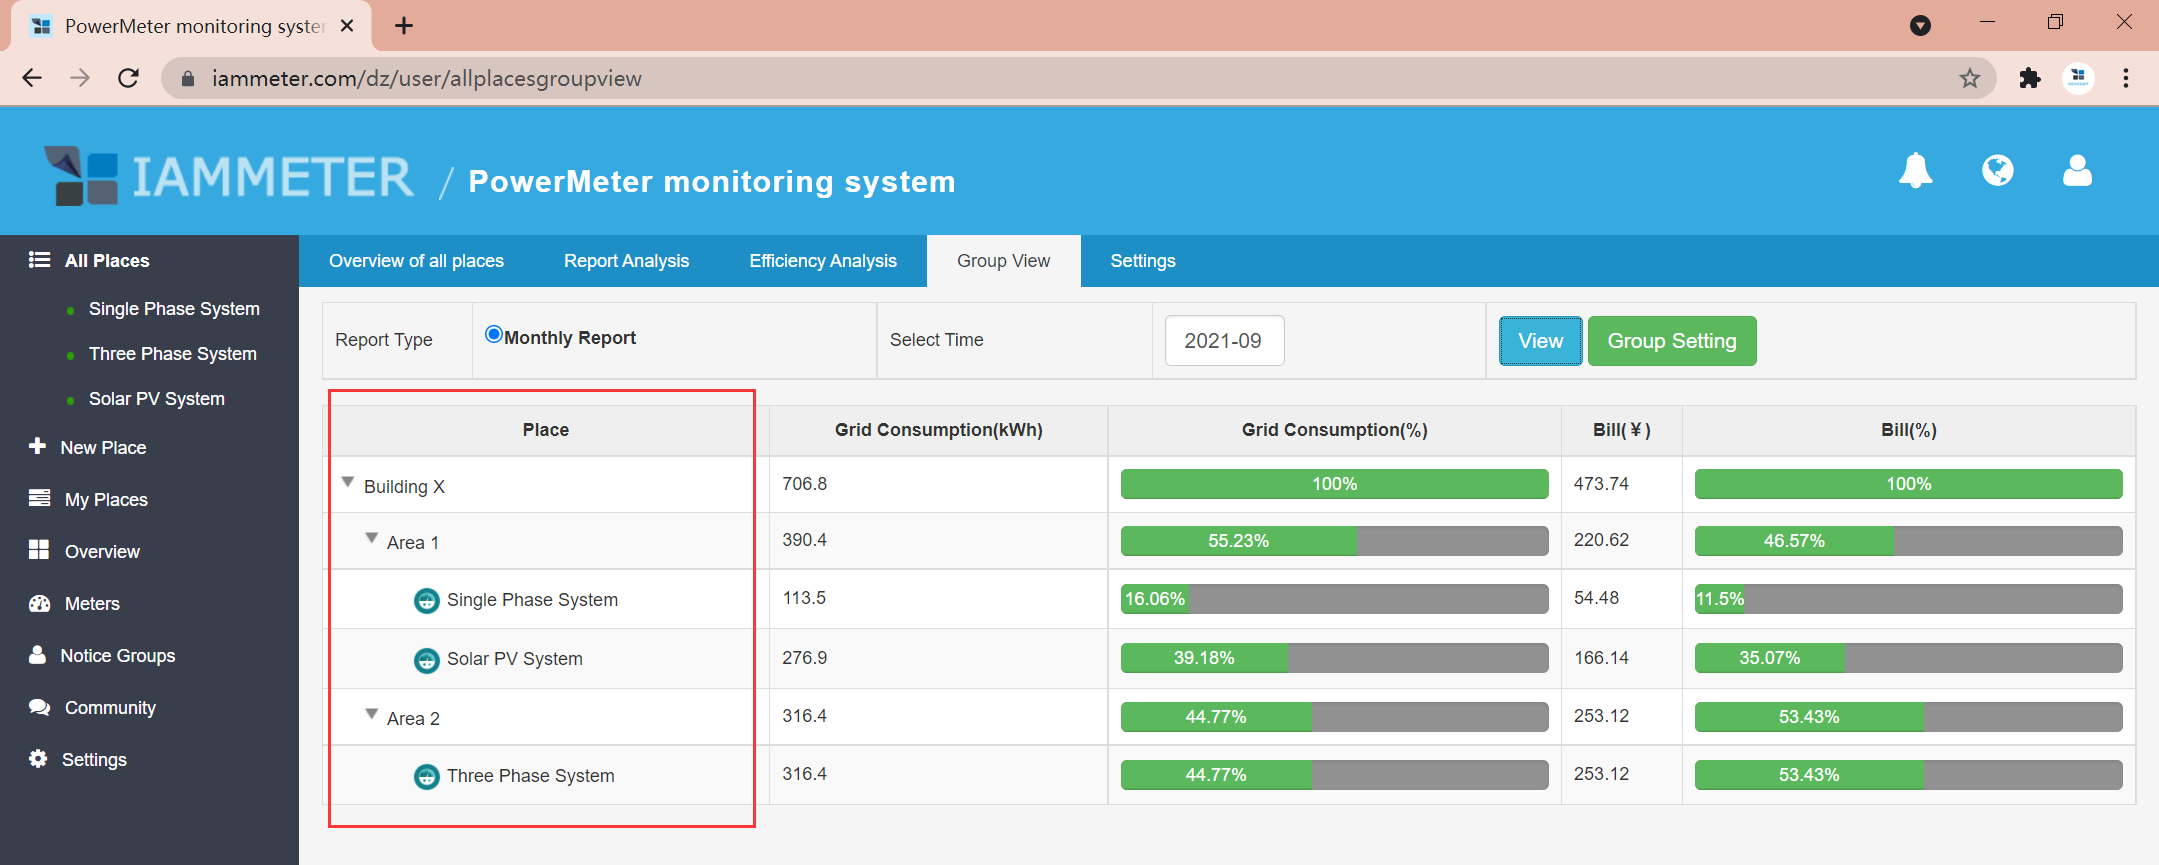
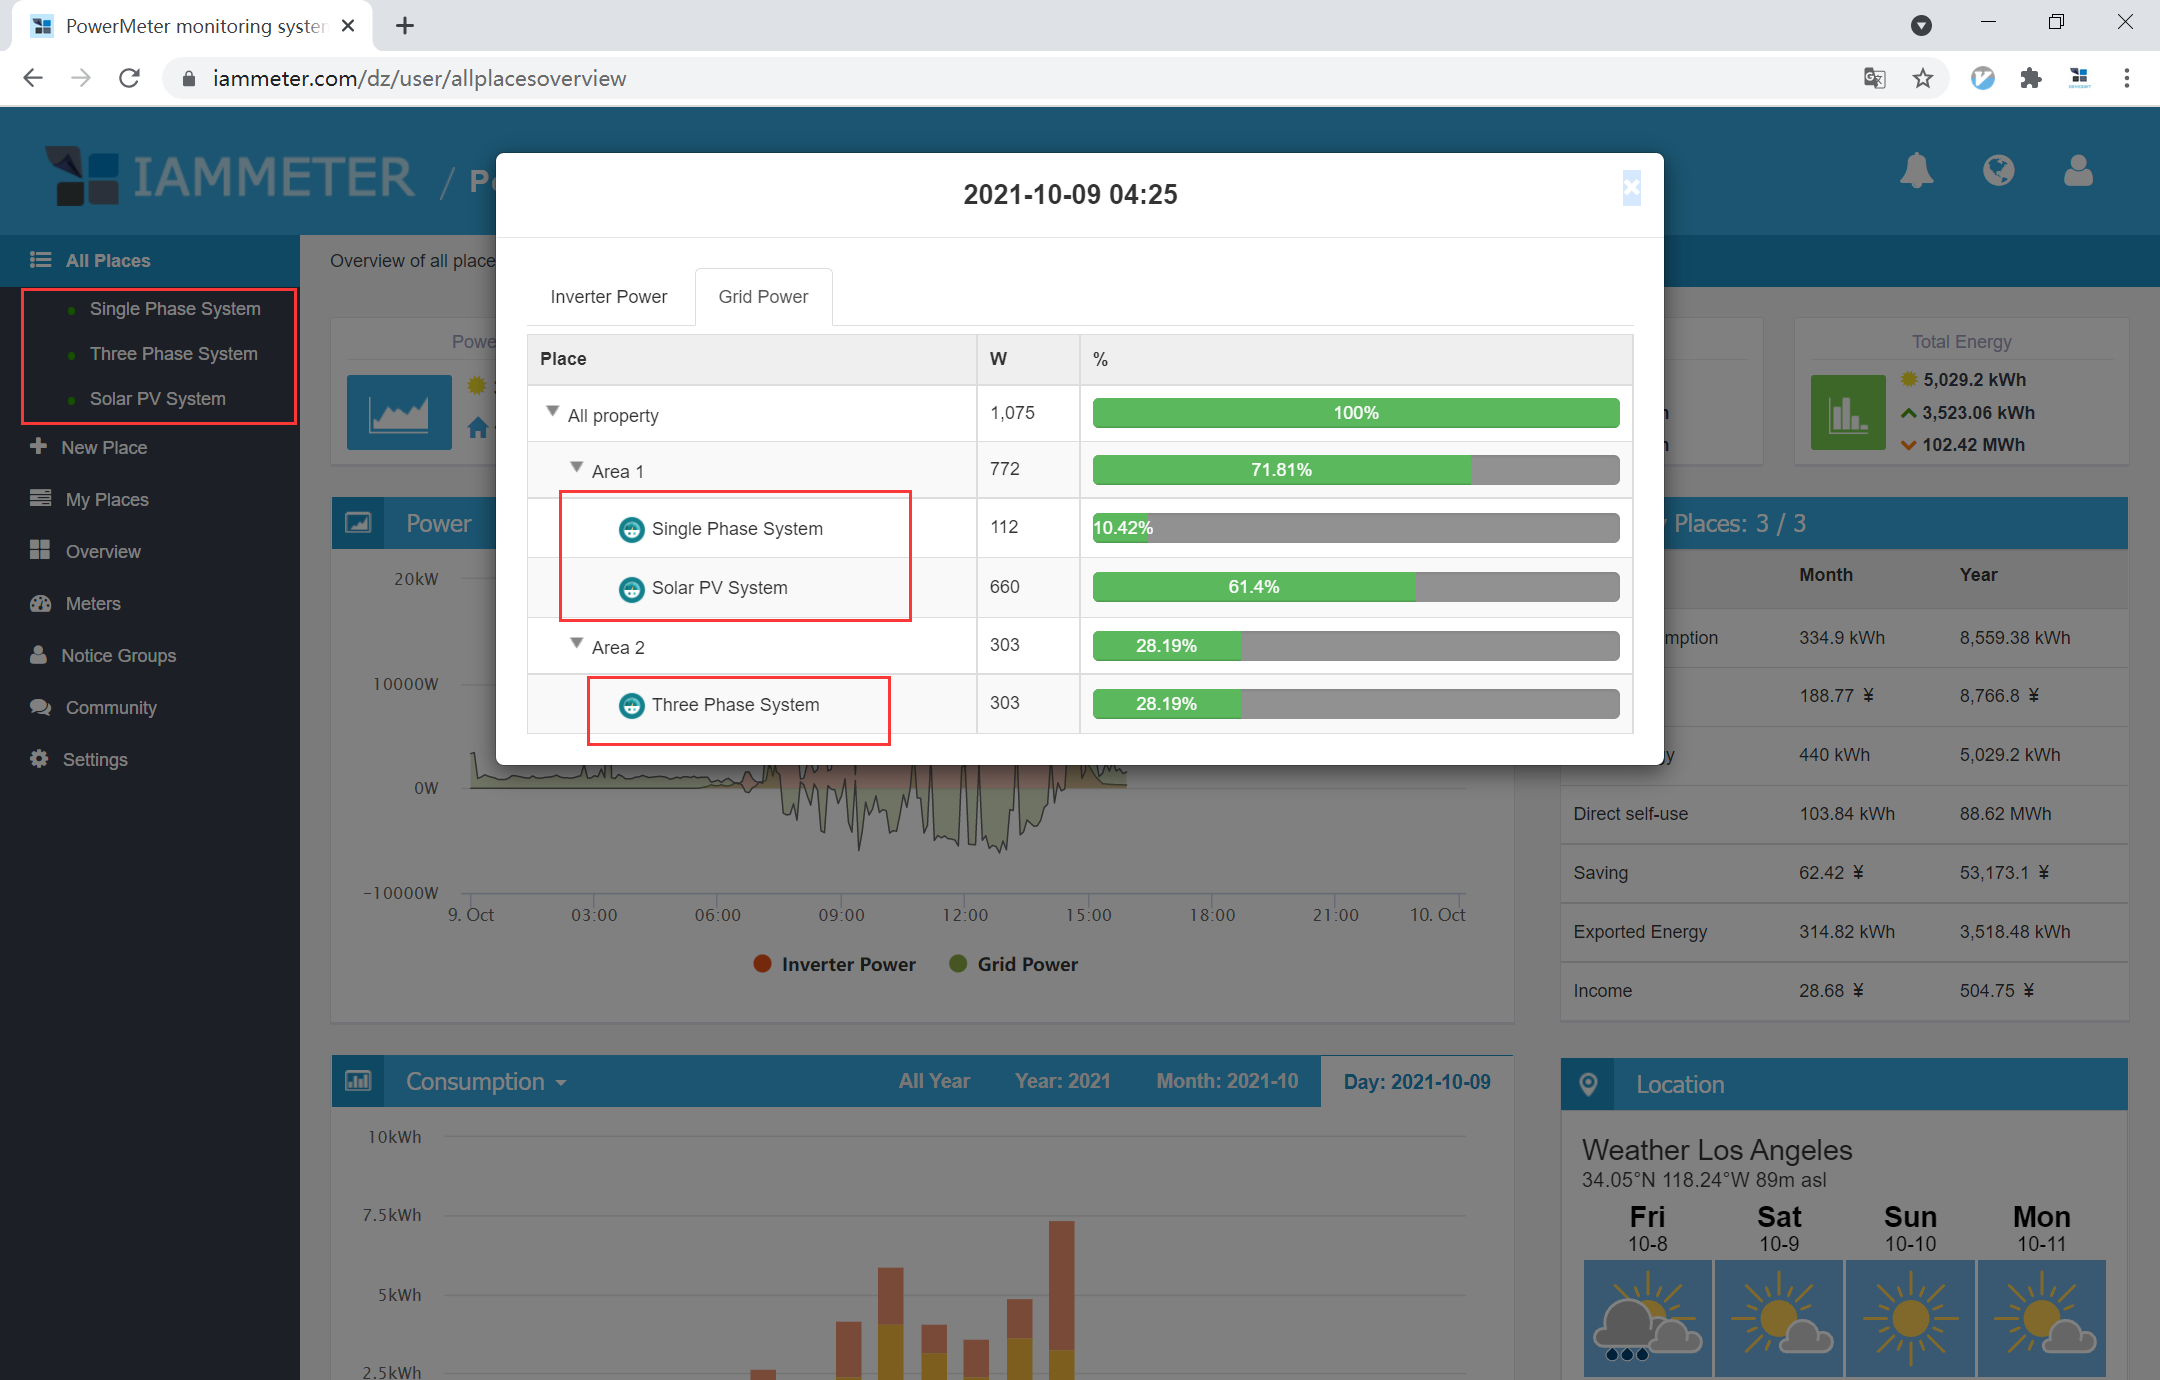
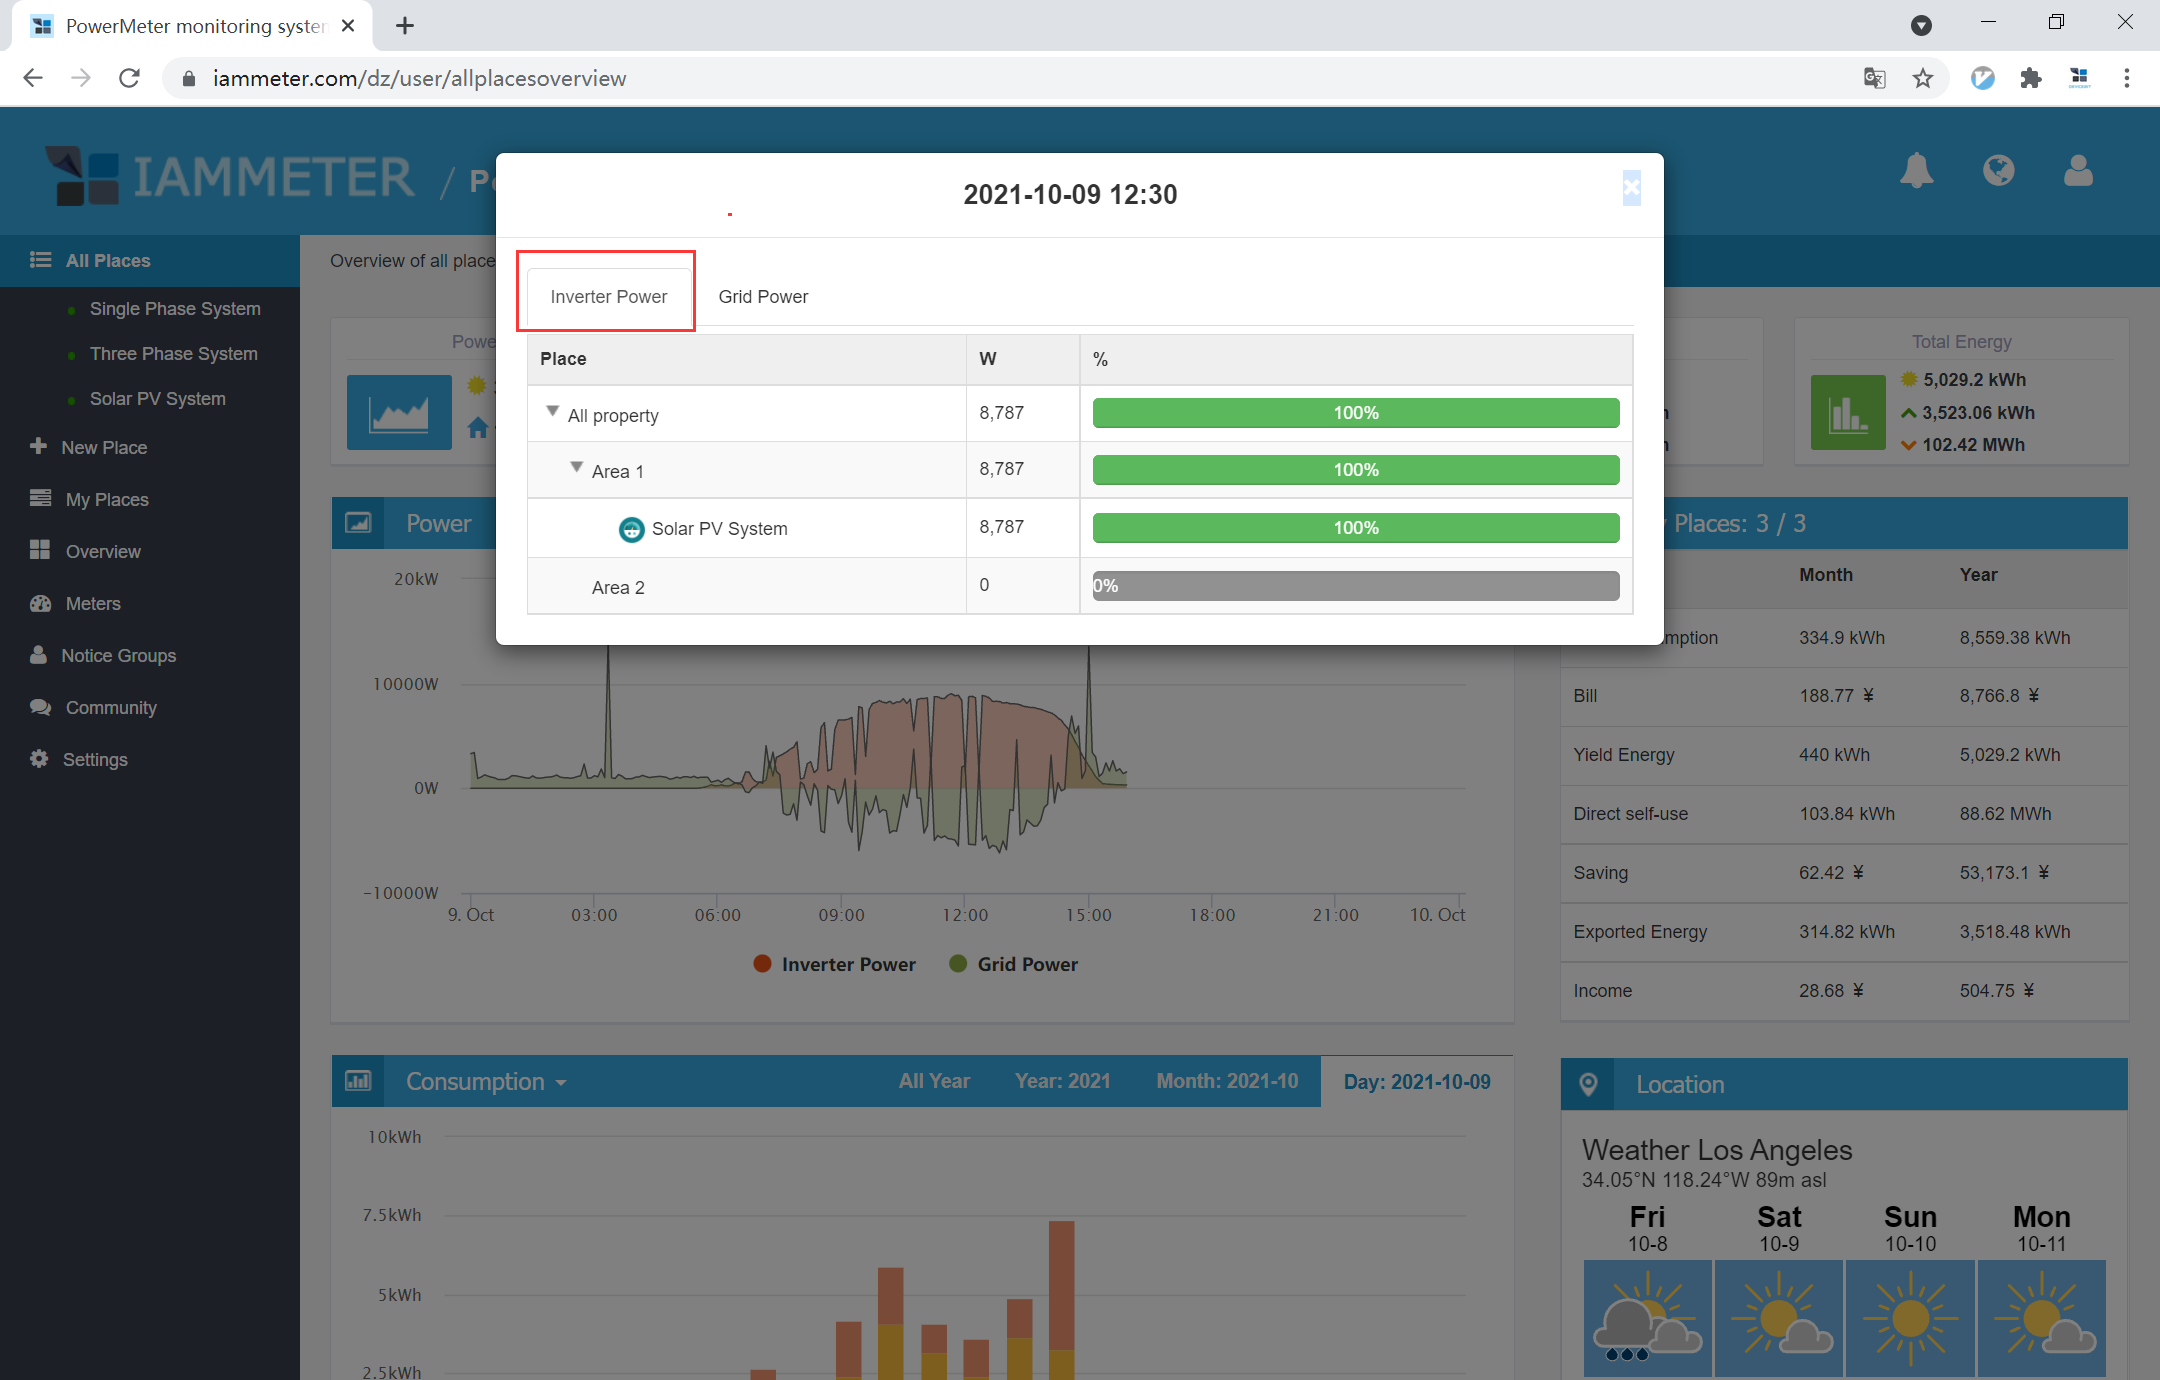
| Comprehensive visualization | View total and per-site power, energy, and billing information in one dashboard. |
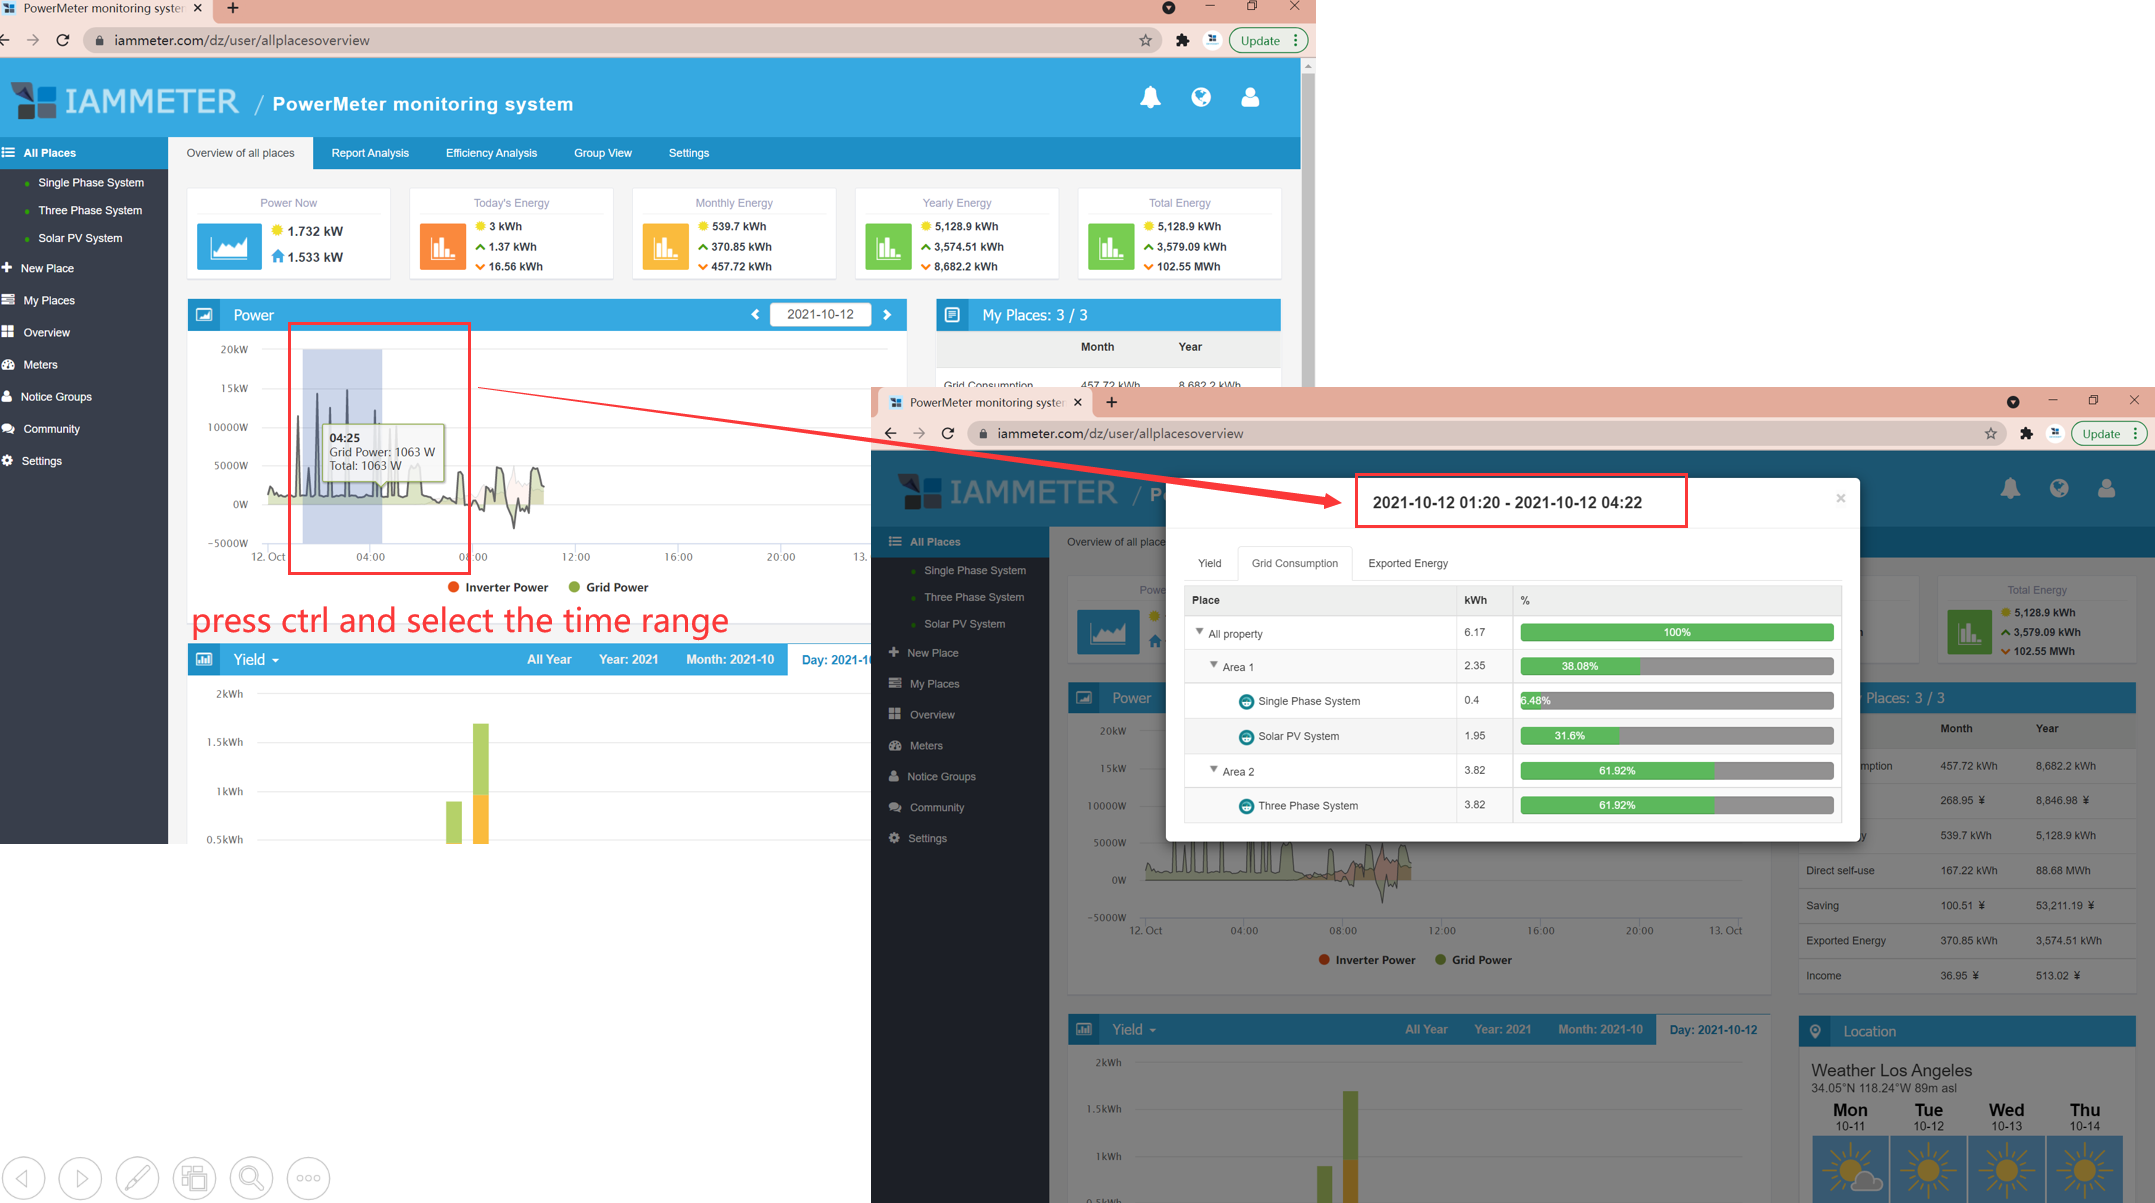
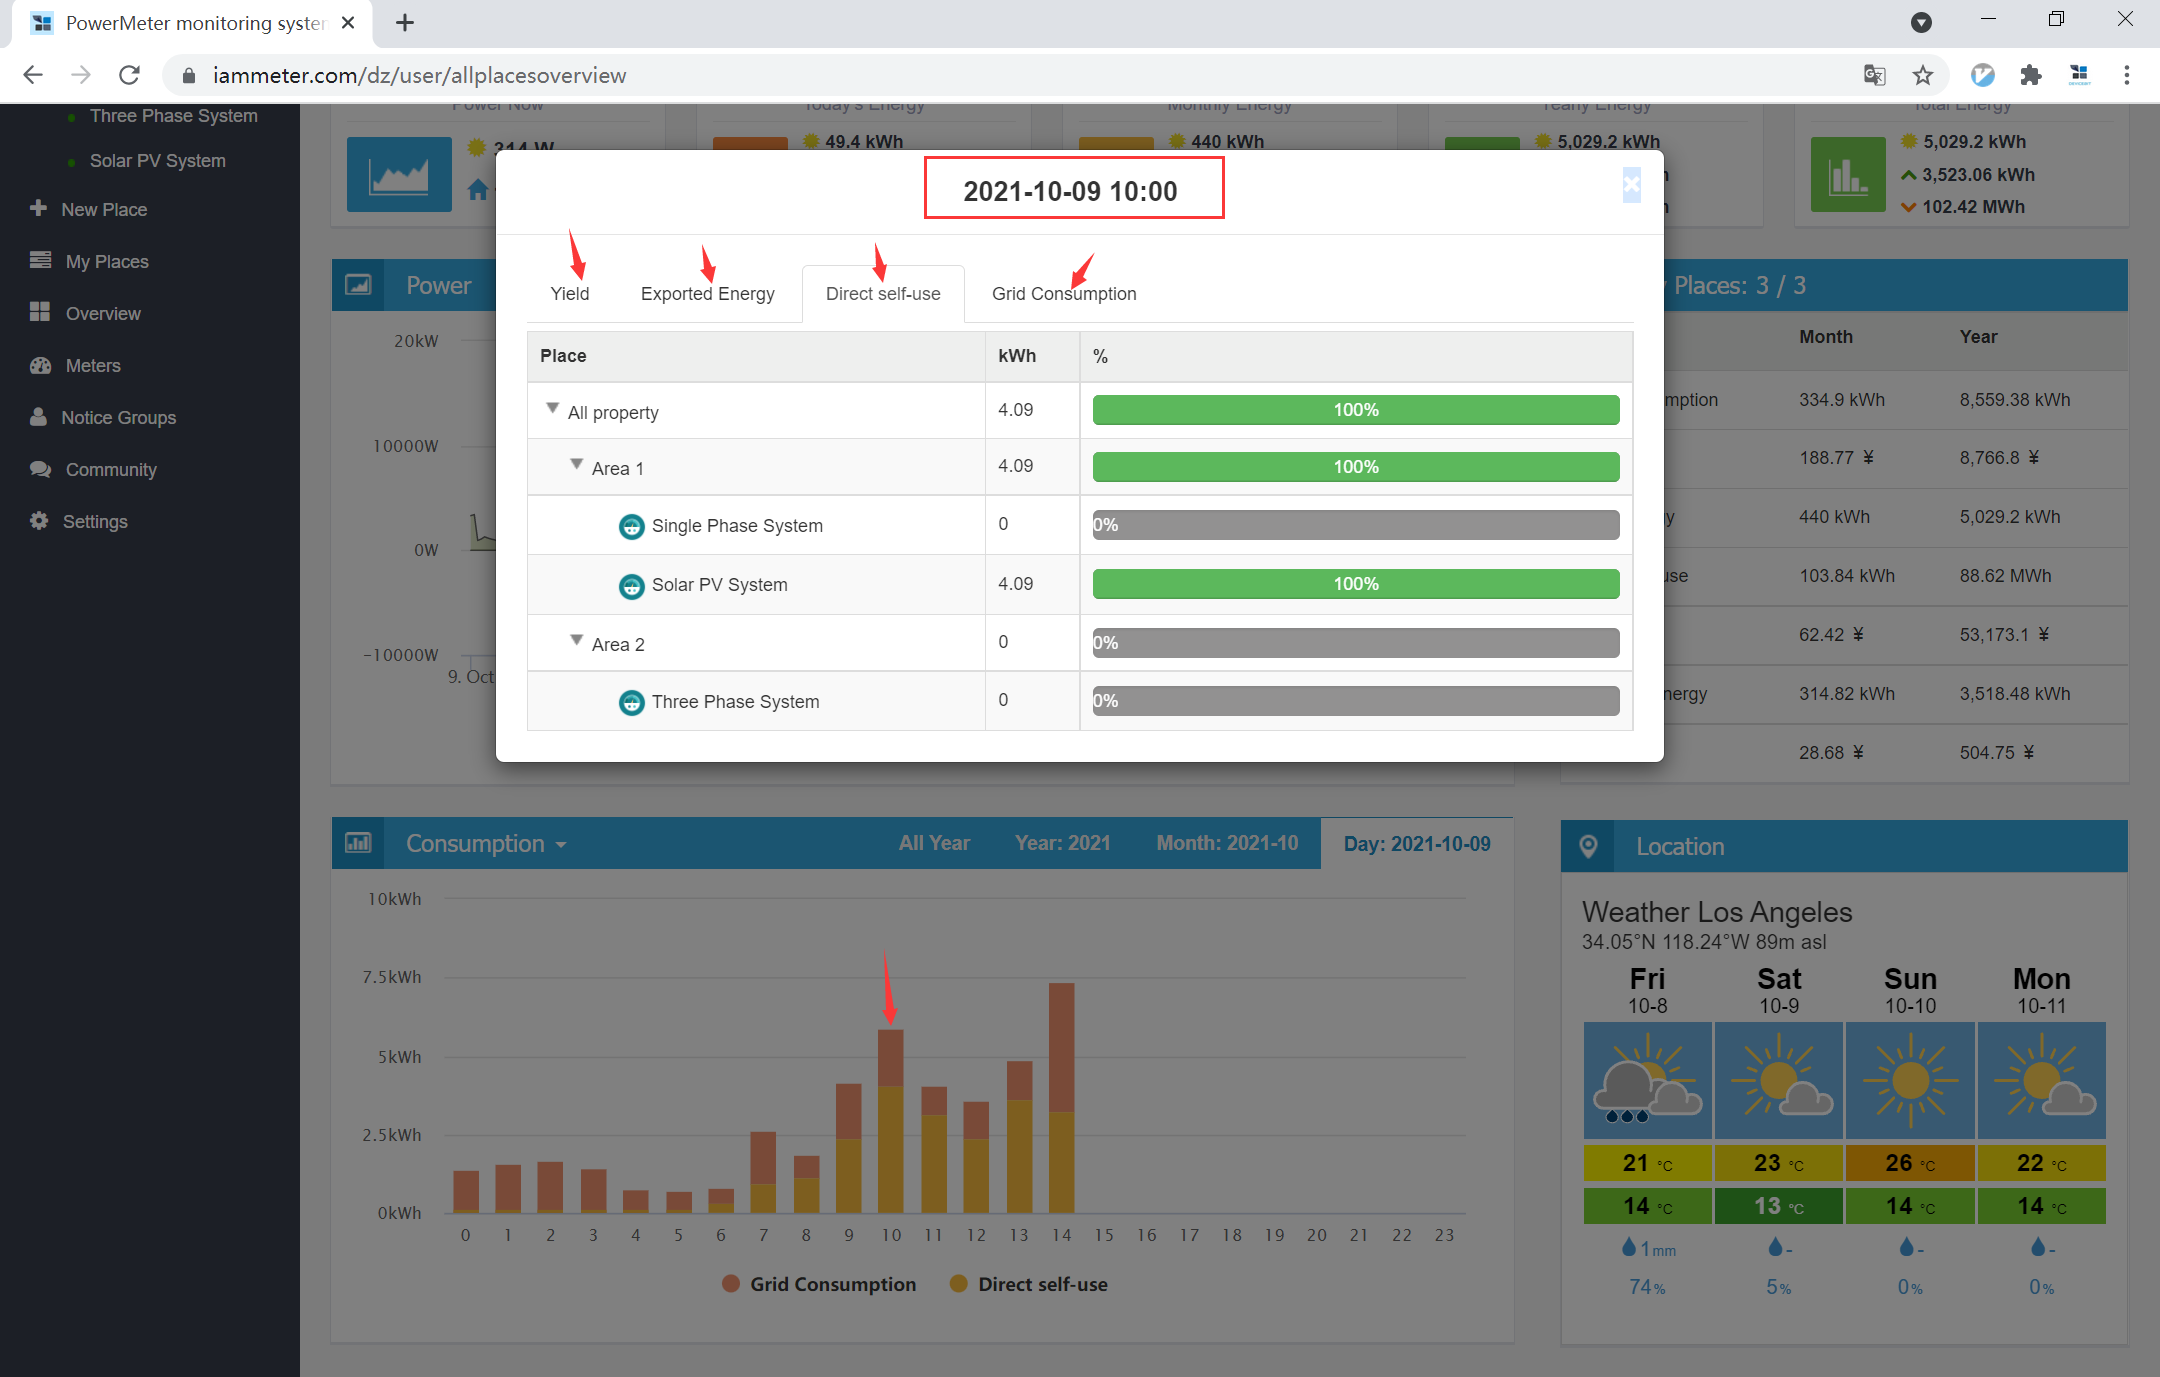
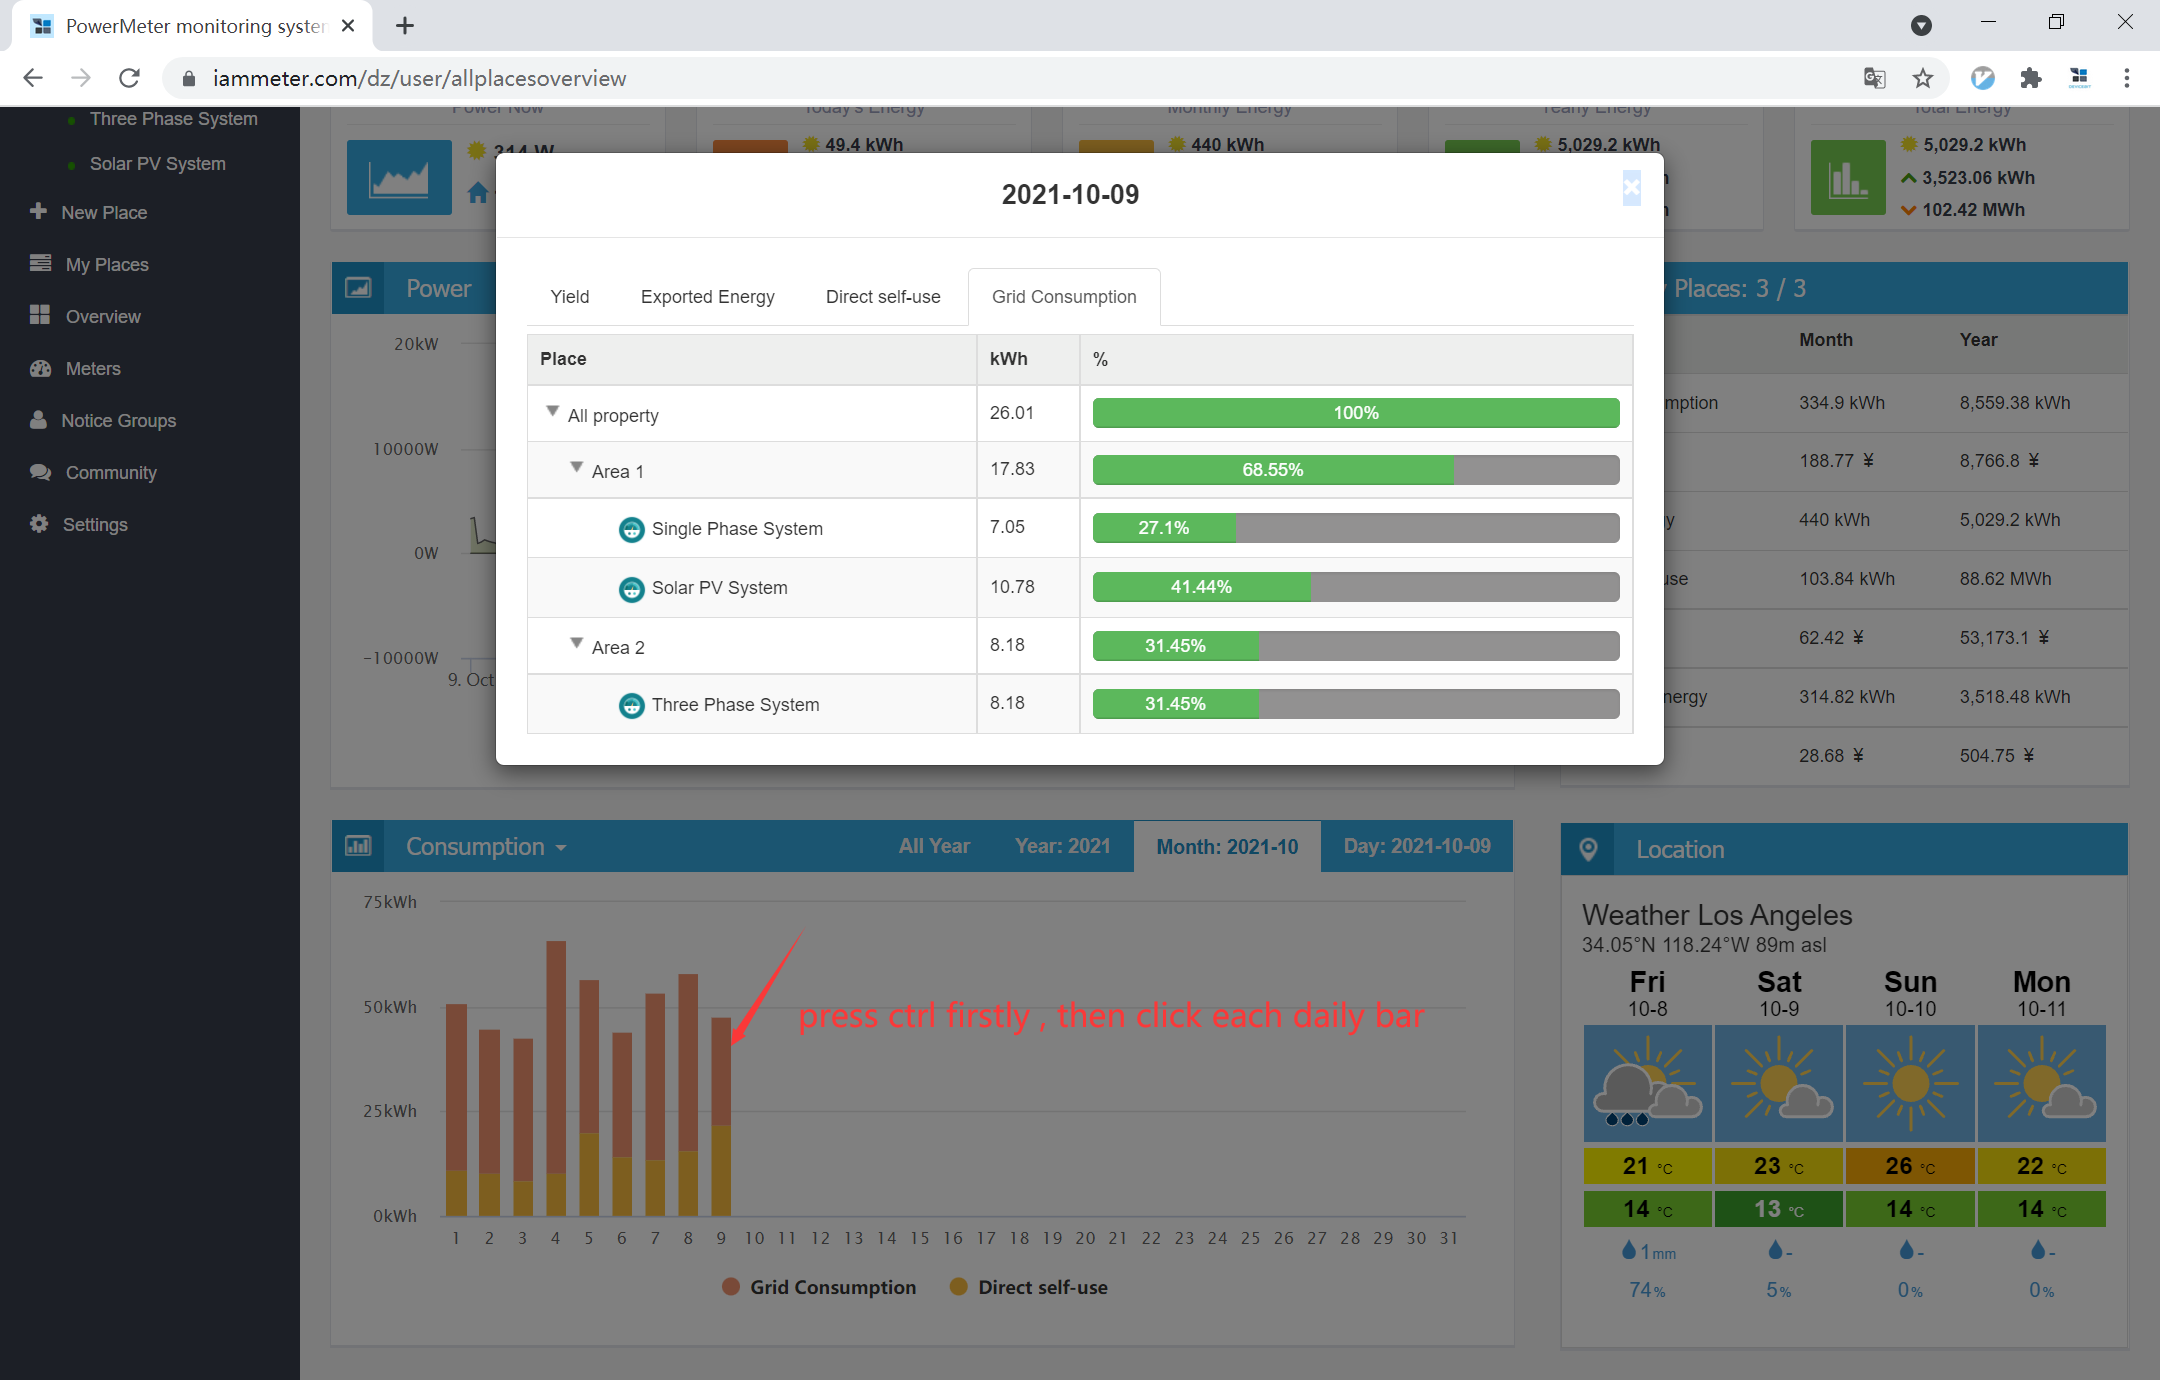
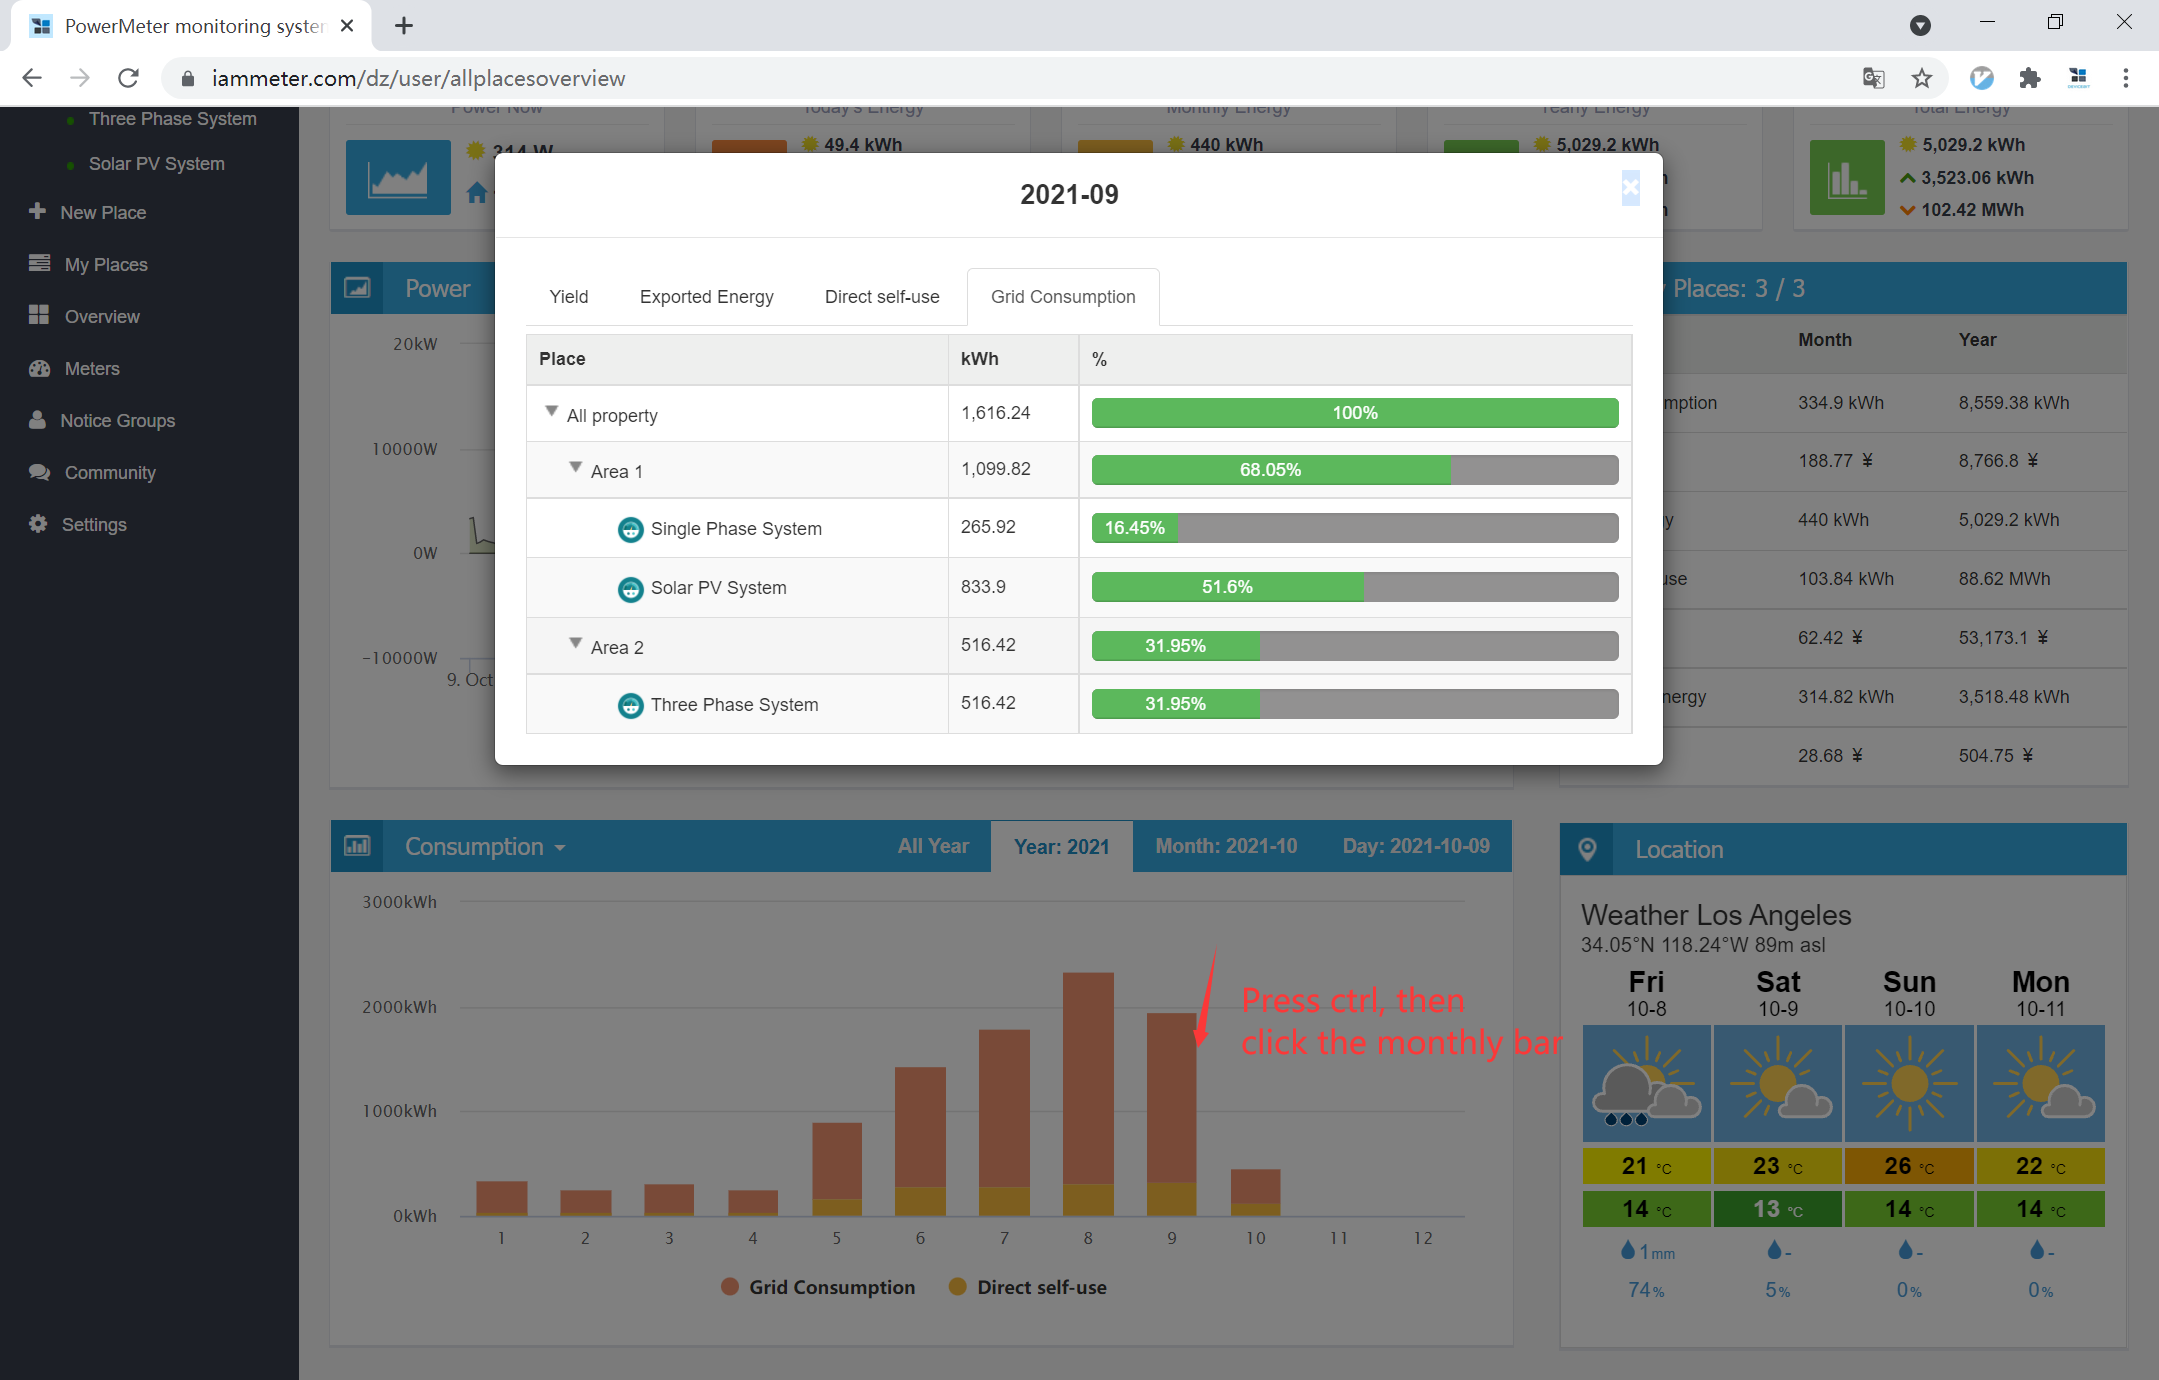
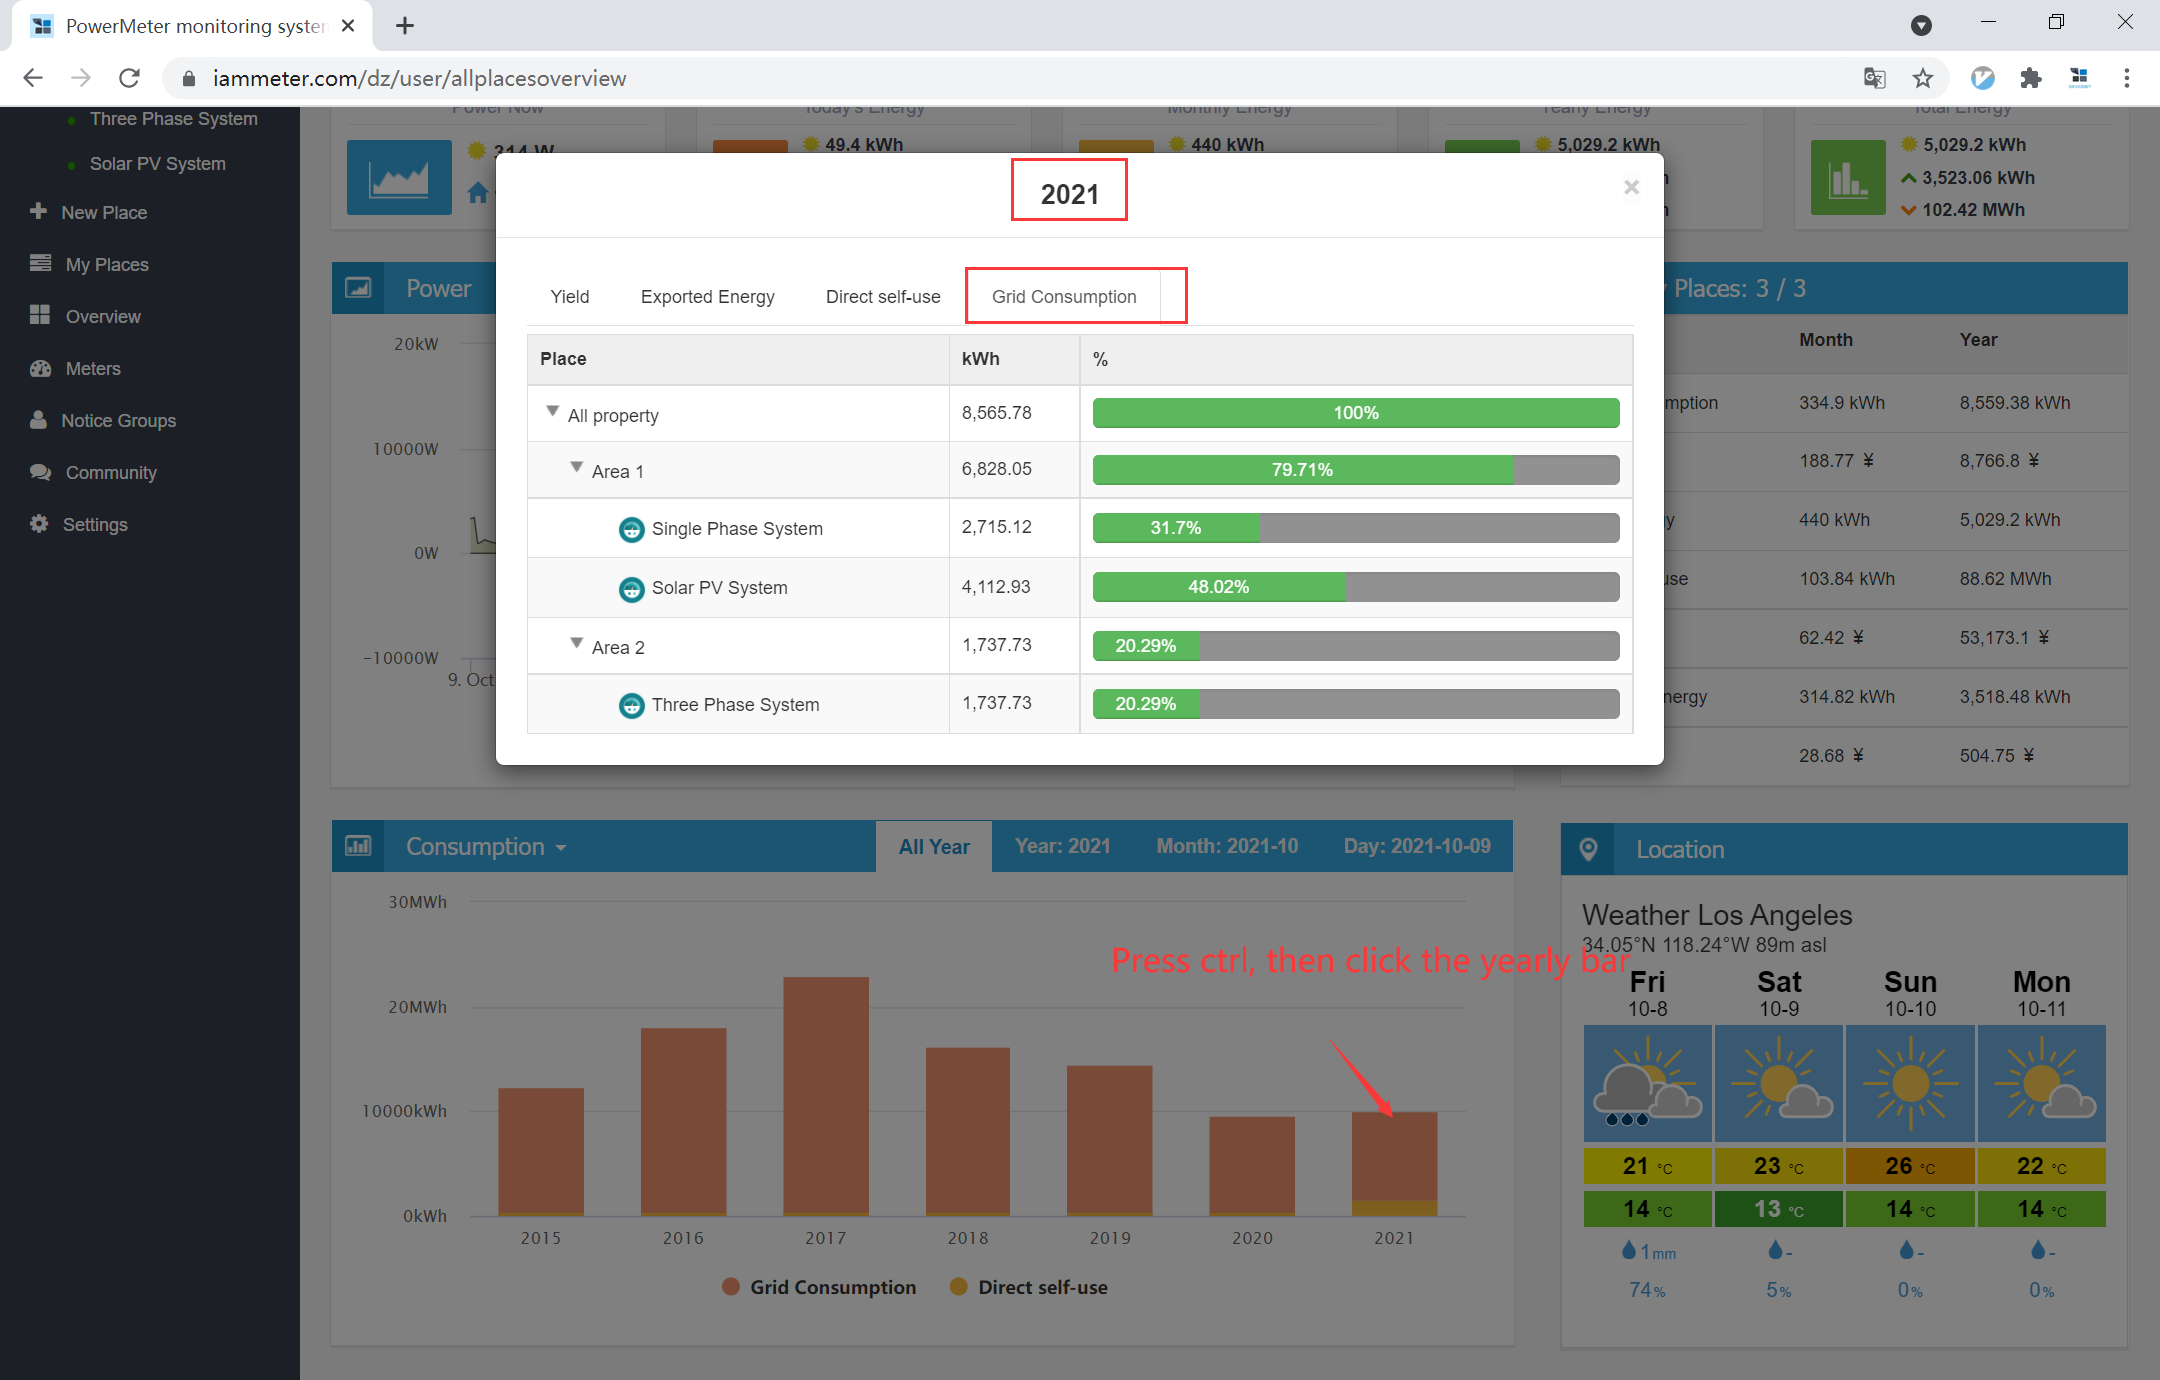
| Time-range analysis | Select specific time periods on graphs (Ctrl + drag) for detailed analysis. |
| Multi-level time granularity | Analyze energy data by hour, day, month, or year. |
| Solar PV comparison | Compare performance across multiple solar PV systems. |
| Unified billing and tariff summary | Aggregate consumption cost and solar income reports. |

Note: Each Place must have its own tariff setting configured individually. See How to Set Power Tariffs for details.
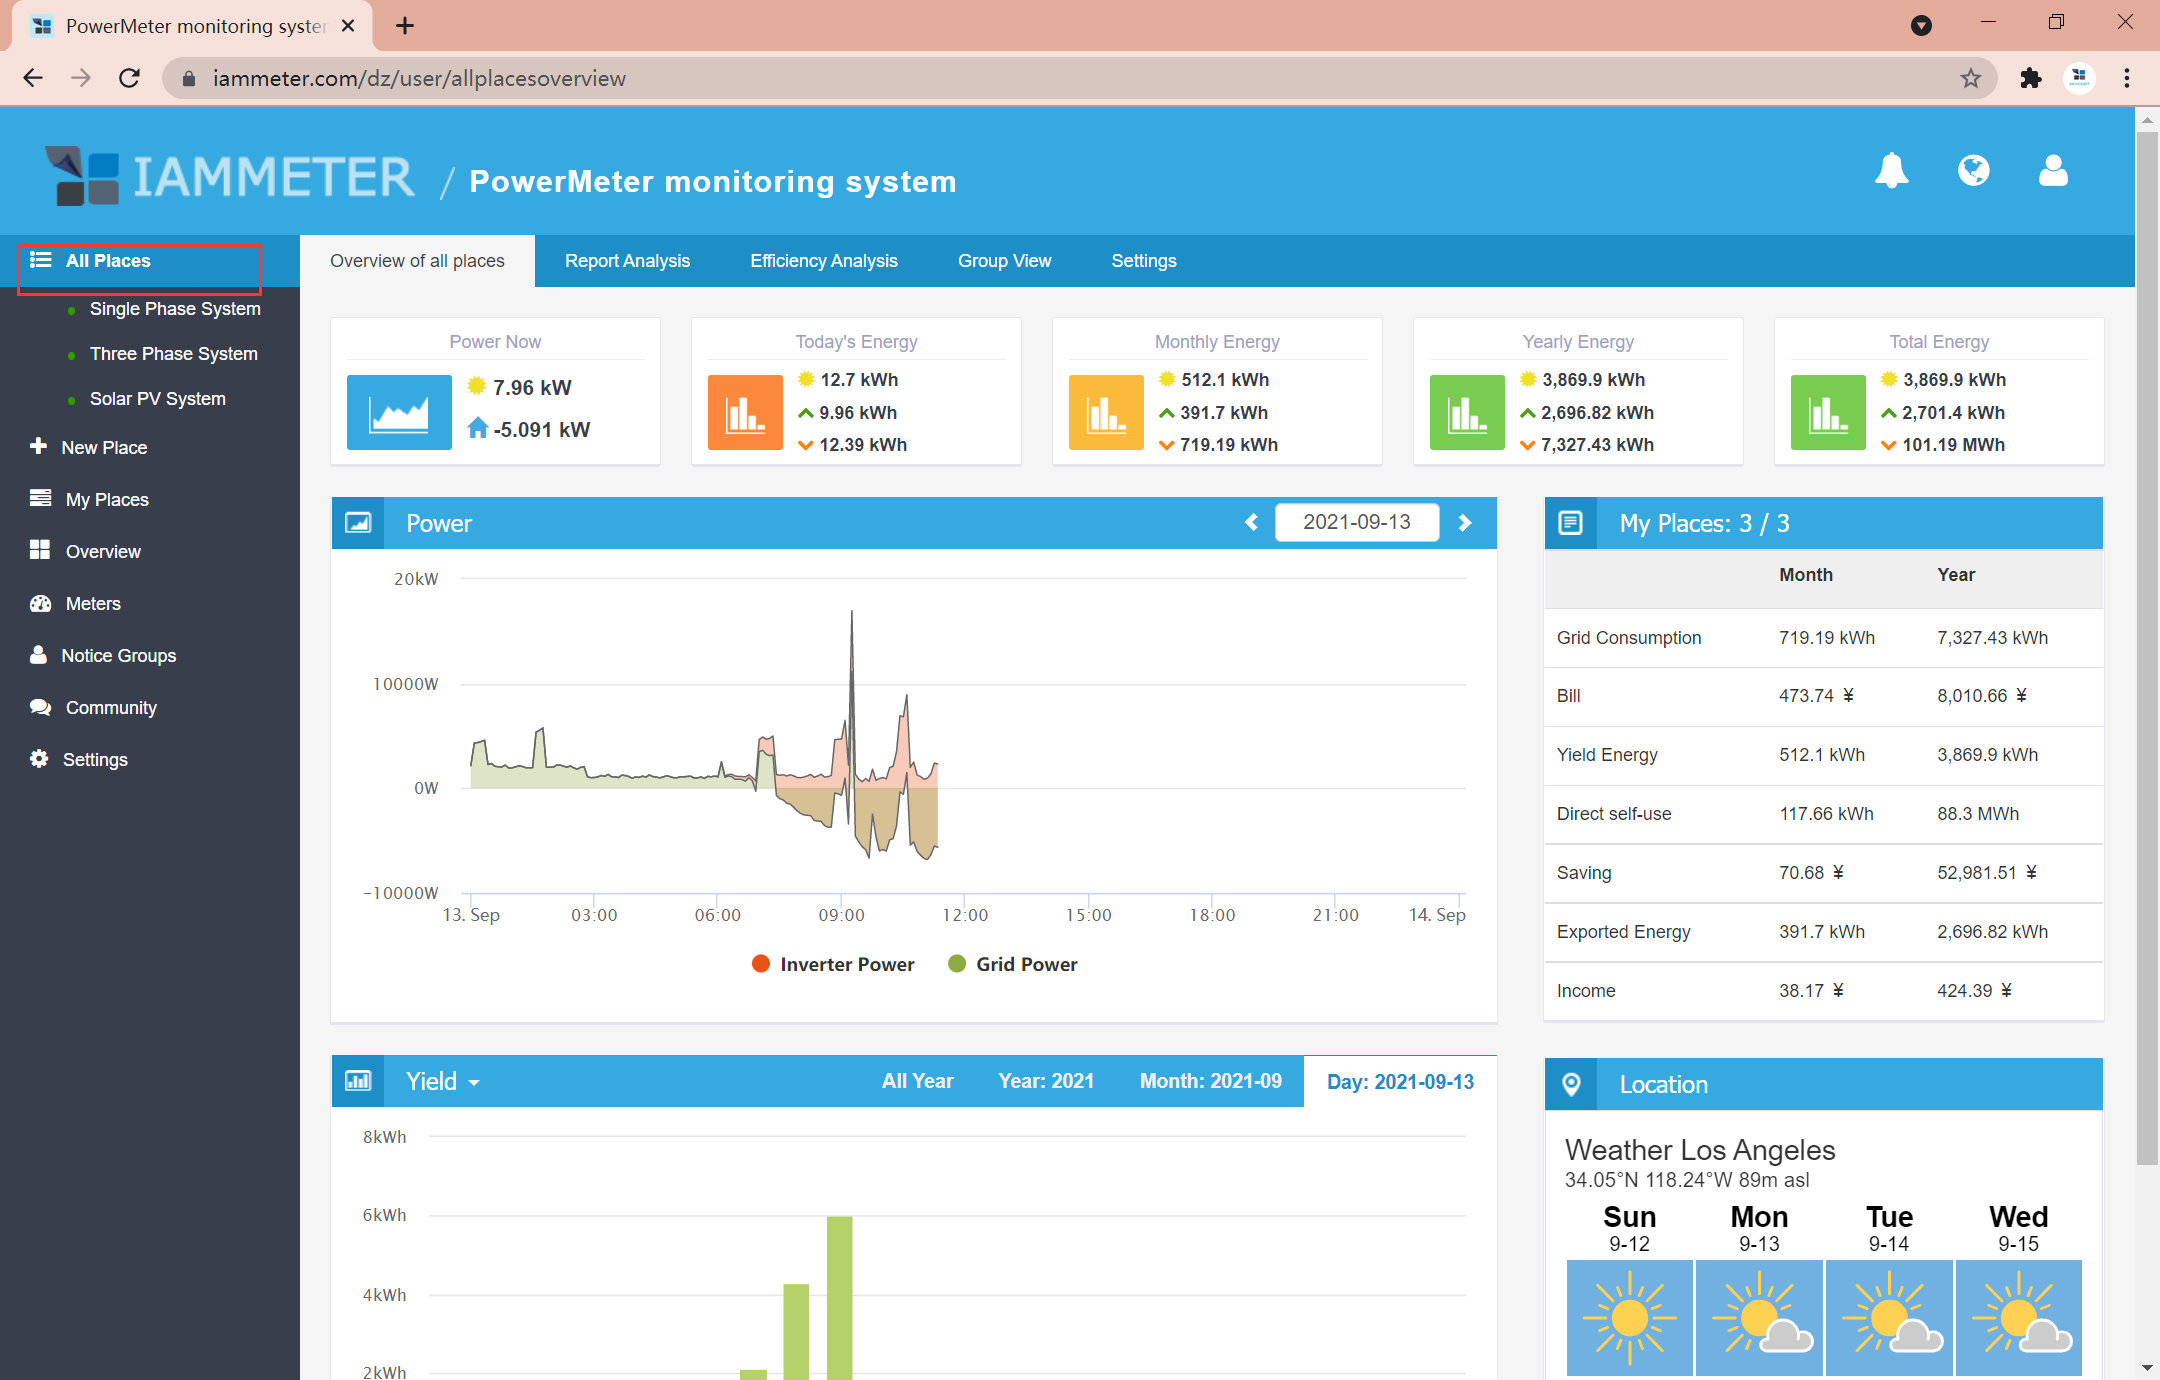
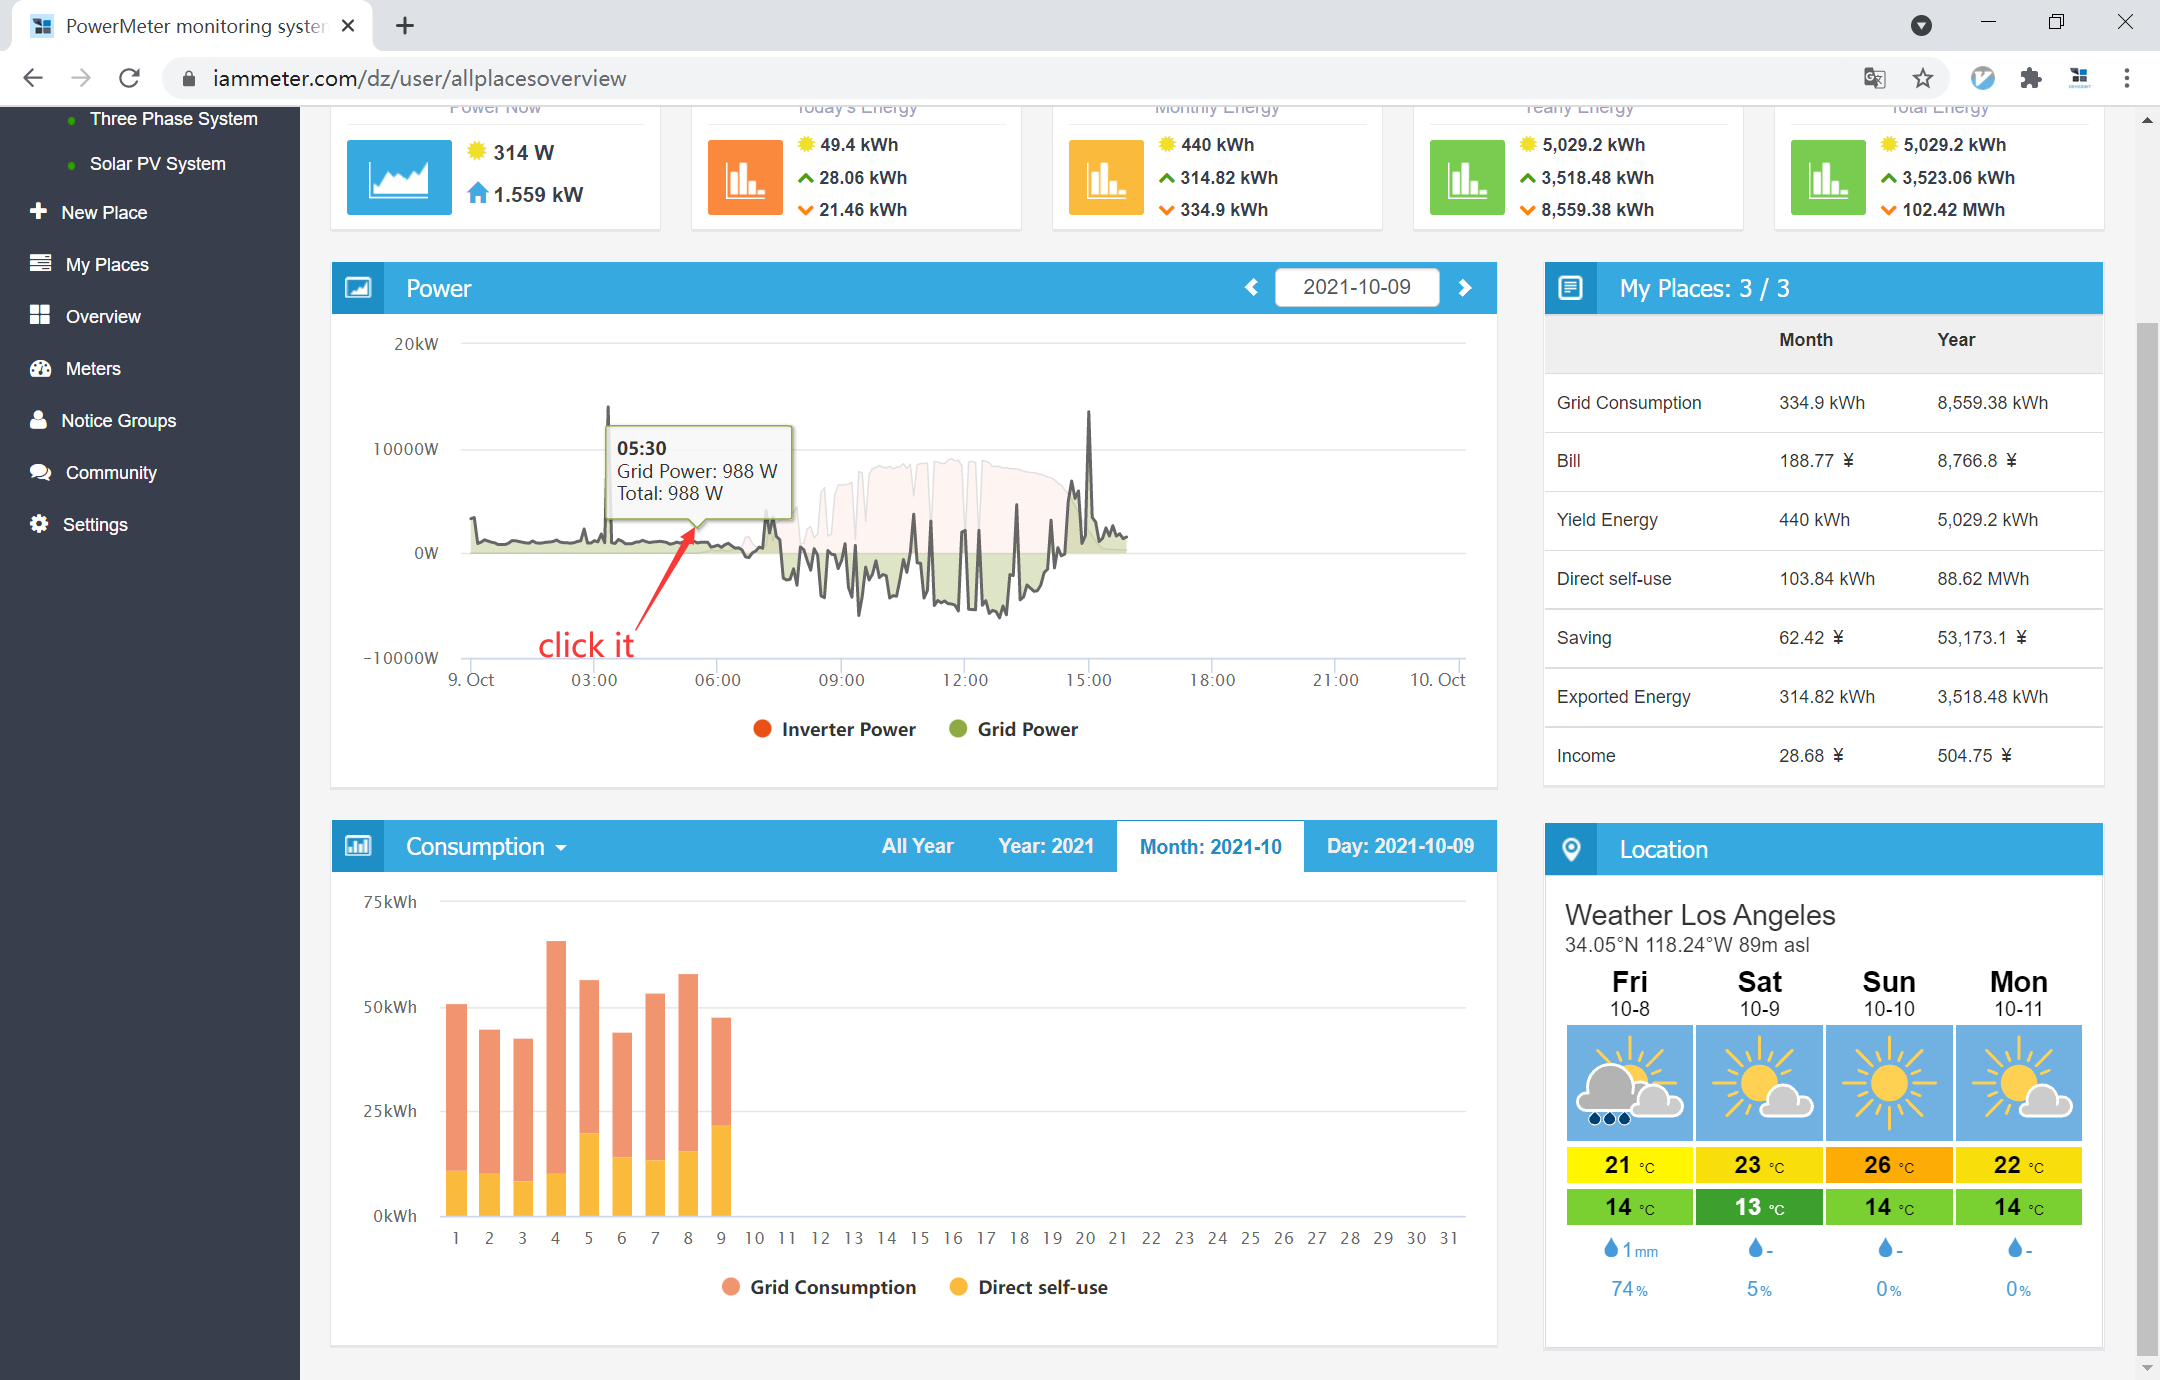
IAMMETER-Cloud provides multiple visualization tools for Virtual Sites:
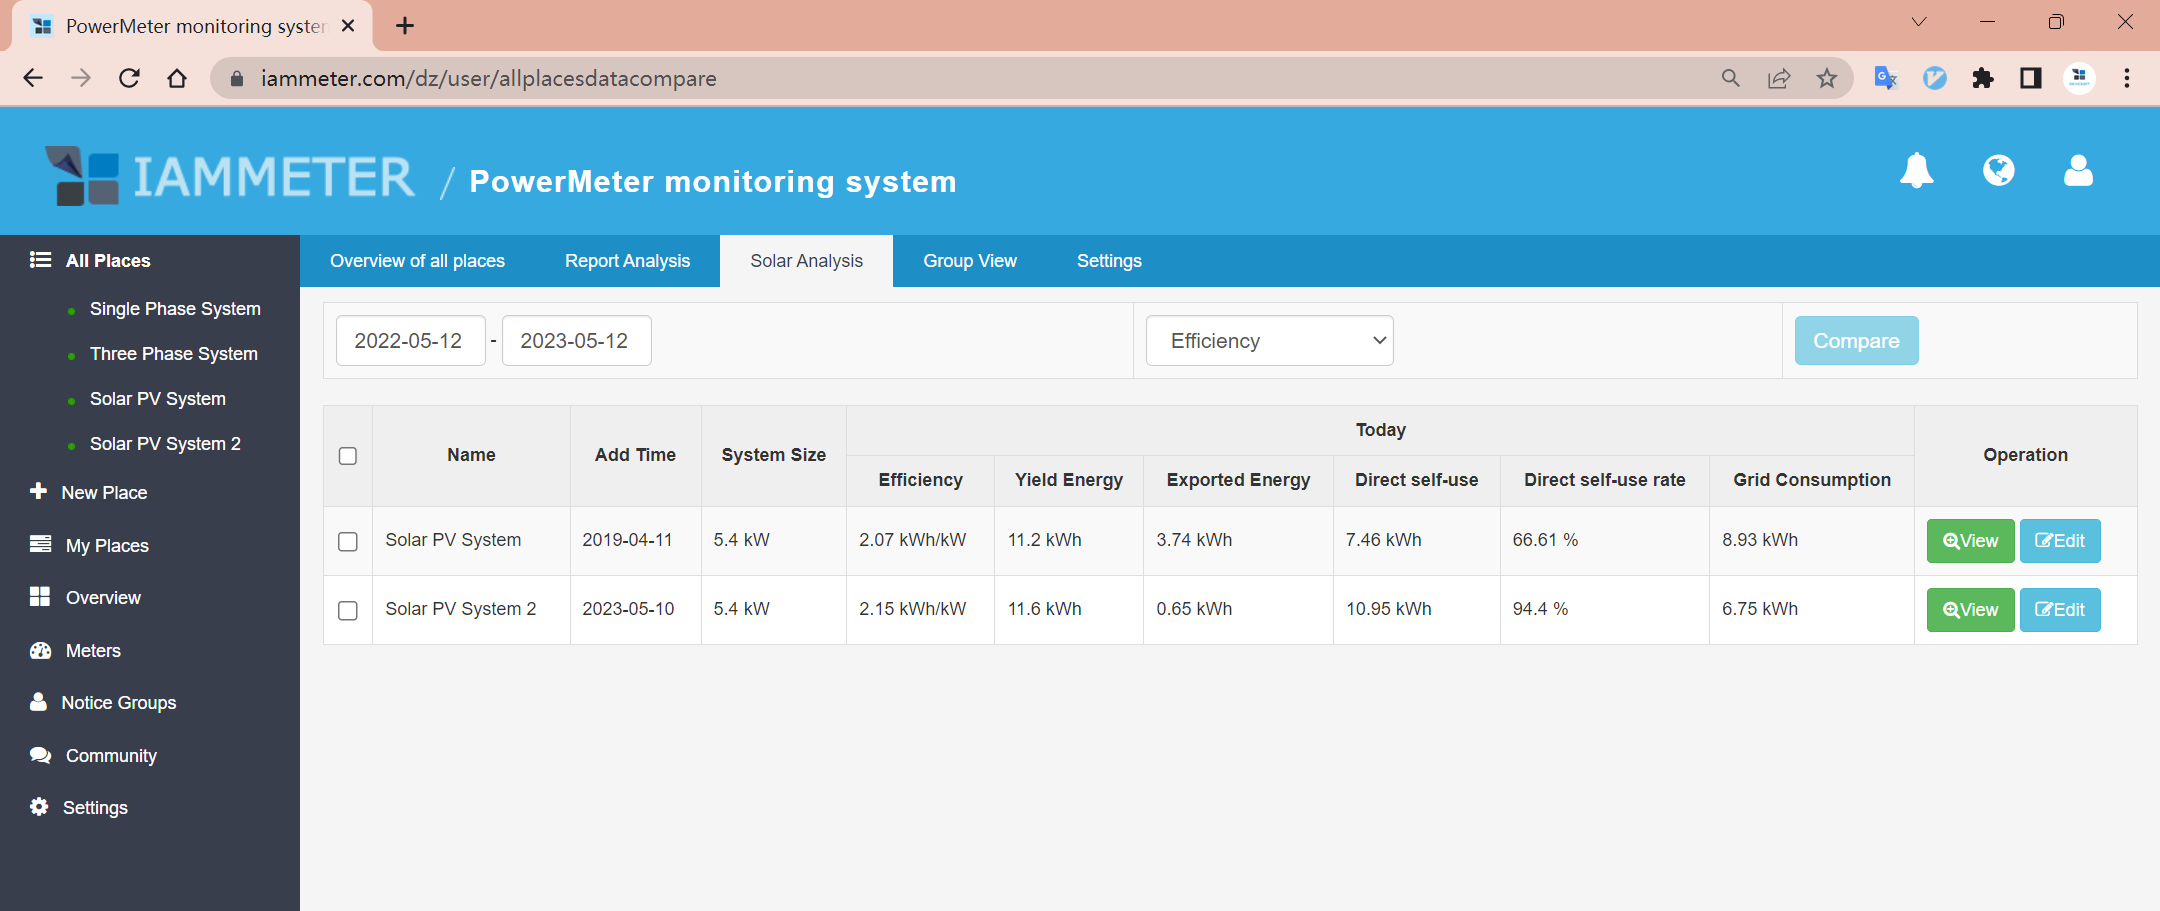
For users managing multiple solar PV systems, the Virtual Site feature offers advanced comparative analysis:
Reference: Sort and Compare Multiple Solar PV Sites
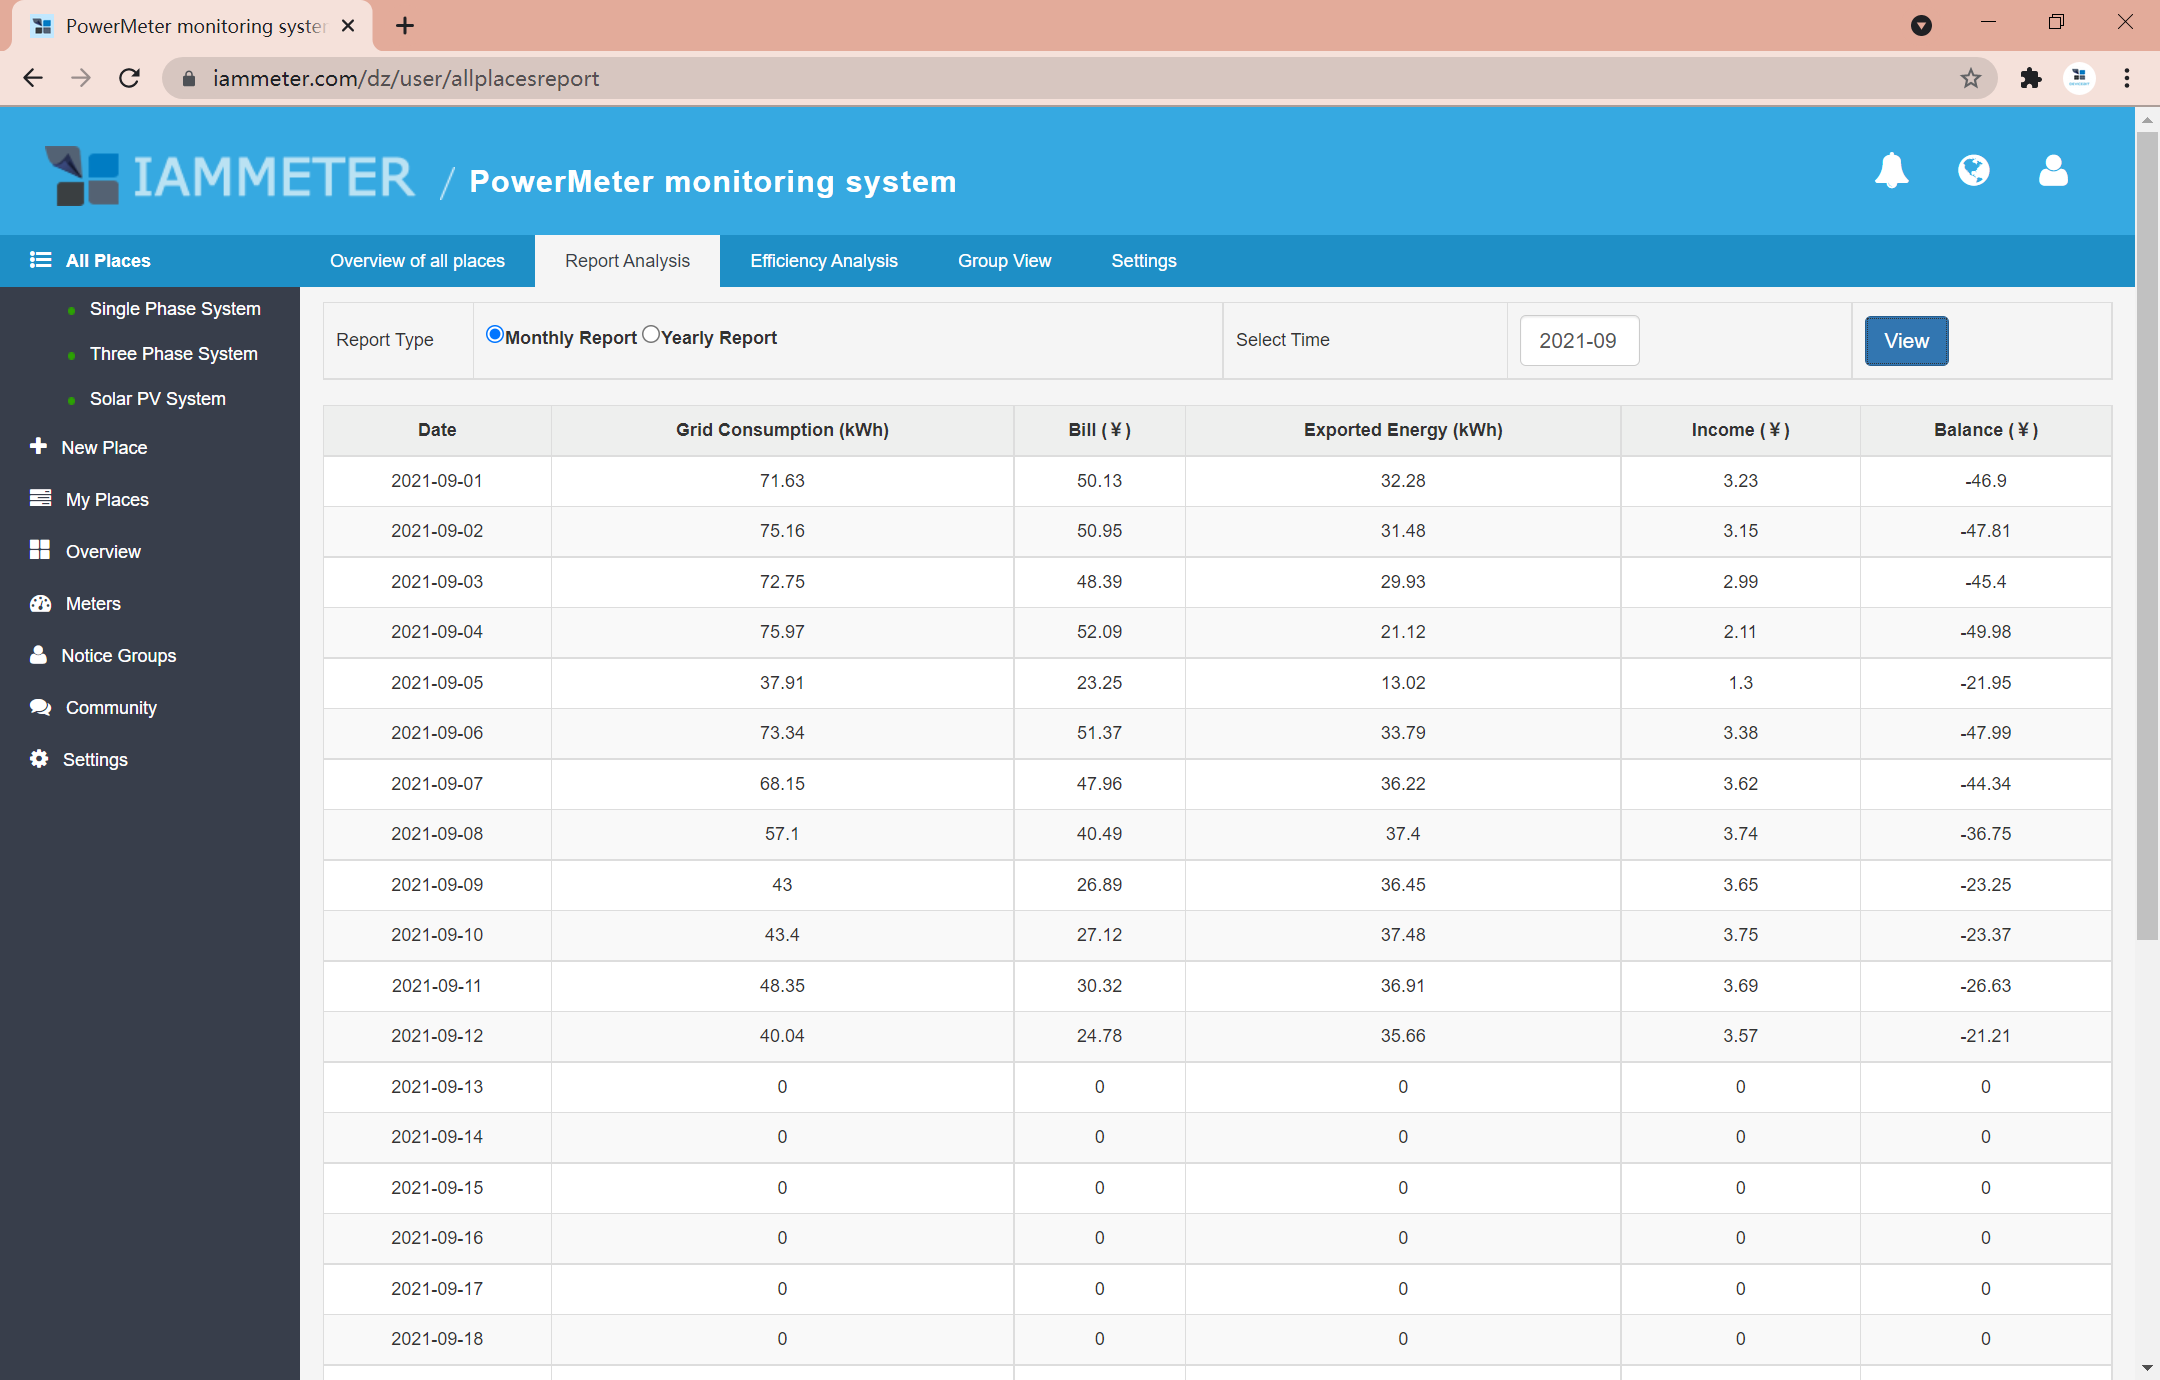
Generate comprehensive reports combining energy consumption, billing, and solar income data from all selected sites.
API Reference: IAMMETER-Cloud API Documentation
| Scenario | Example | Benefit |
|---|---|---|
| Enterprise energy management | Headquarters + branch offices | Aggregate company-wide energy usage and cost. |
| Industrial parks | Multiple factories or workshops | Hierarchical monitoring of energy per unit or building. |
| Solar PV operators | Several regional PV plants | Compare generation efficiency and profitability. |
| Property management | Multiple apartment or office buildings | Centralized cost tracking and energy allocation. |
The Virtual Site feature in IAMMETER-Cloud transforms multiple individual energy meters or solar PV systems into a unified, hierarchical dashboard. It helps users:
Virtual Site turns your distributed meters into a single intelligent energy management ecosystem — clear, scalable, and insightful.

Three Phase Wi-Fi Energy Meter (WEM3080T)

Single Phase Wi-Fi Energy Meter (WEM3080)
")
Three Phase Wi-Fi Energy Meter (WEM3046T)
")
Three Phase Wi-Fi Energy Meter (WEM3050T)