


Sort and compare more than one solar PV site in the solar analysis
Introduction
This feature would help the customers to analyze the daily performance difference between their different solar PV sites in one IAMMETER-cloud`s account.
The parameters are listed below,including efficiency, Yield Energy(Kwh),Exported Energy(kWh),Direct self-use(kWh),Direct self-use rate and Grid consumption(kWh).
Video:Maintain more than one solar PV sites in IAMMETER
Highlights of this function
- List and sort all solar PV site together, it is easy to judge the potential problem.(Ex: Two sites are installed not so far away with the same system size. But the daily solar yield is dramatical different)
- Compare the parameter of different solar PV site in selected date range.
Who need this feature
If you are maintaining more than one solar PV site in one IAMMETER account and want to compare their performance directly, this function will help you a lot.
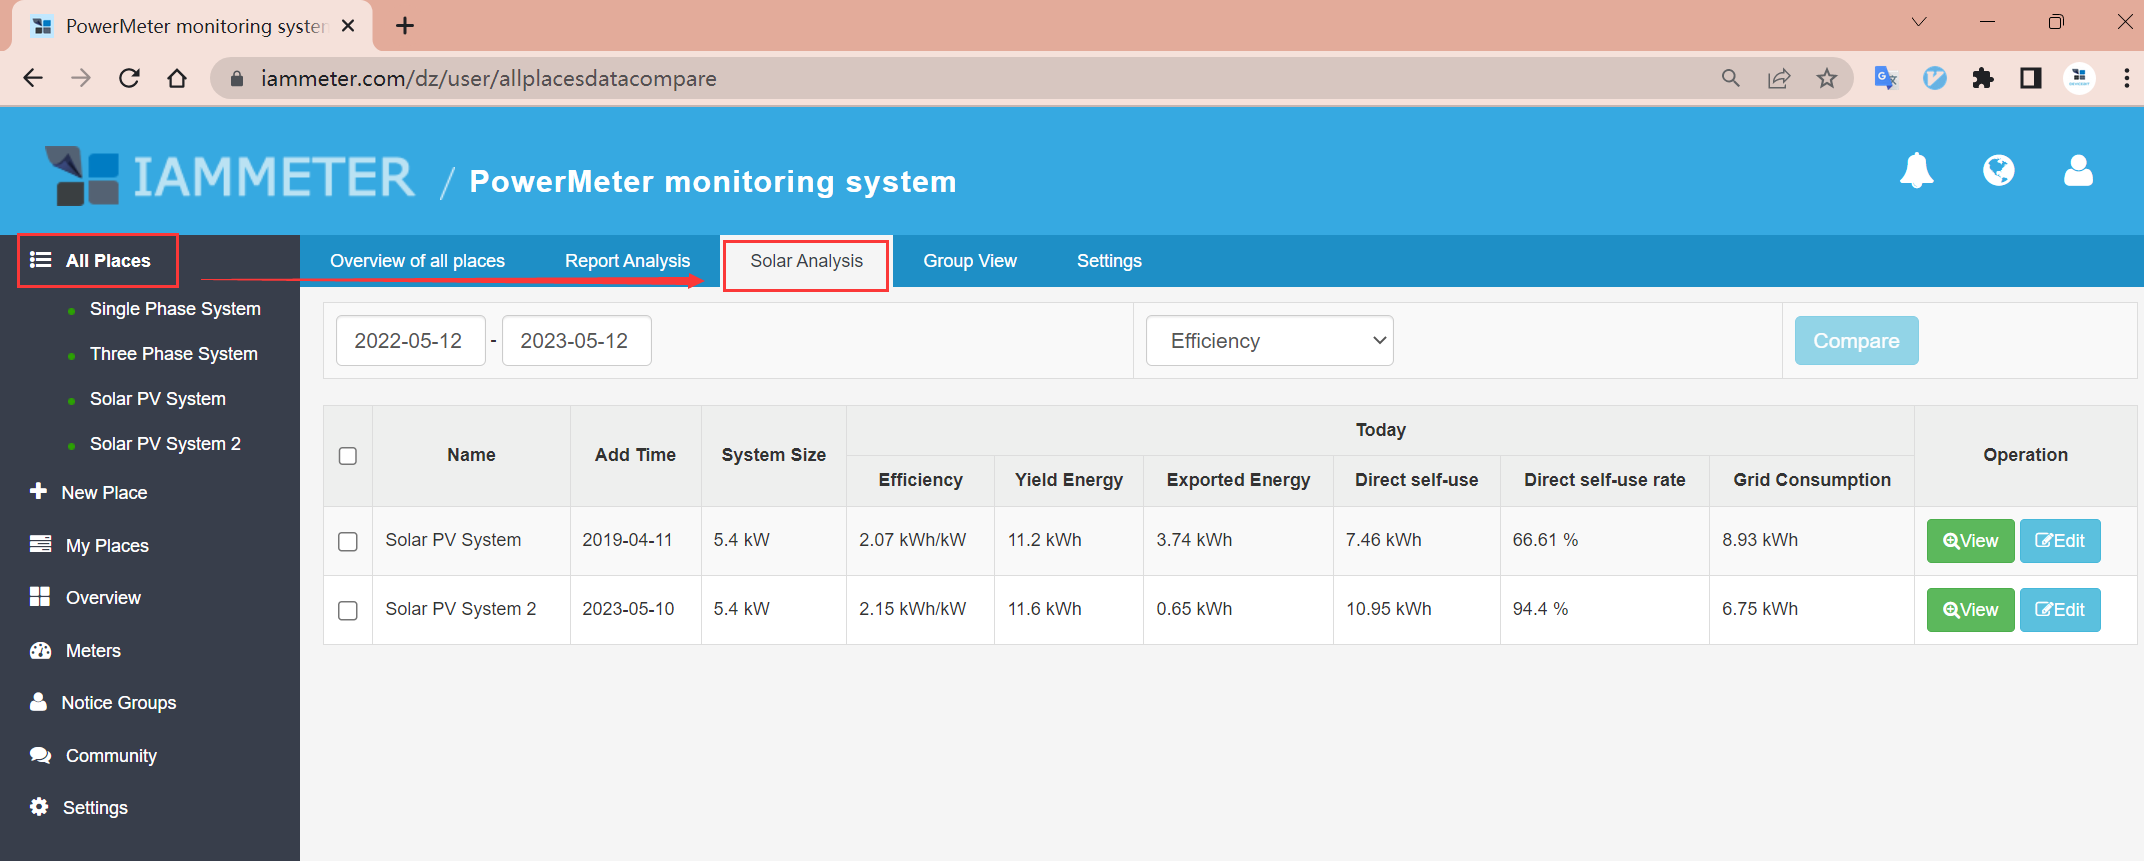
How to use it
All places->solar analysis
Visit the demo account to try this function
Please note:
- This function only exists in the web system(not provided in APP yet), so you need to use the browser of the PC or set the mobile browser in "desktop" mode.
- Please note, this page would only appear when there are more than one Solar PV site in account.
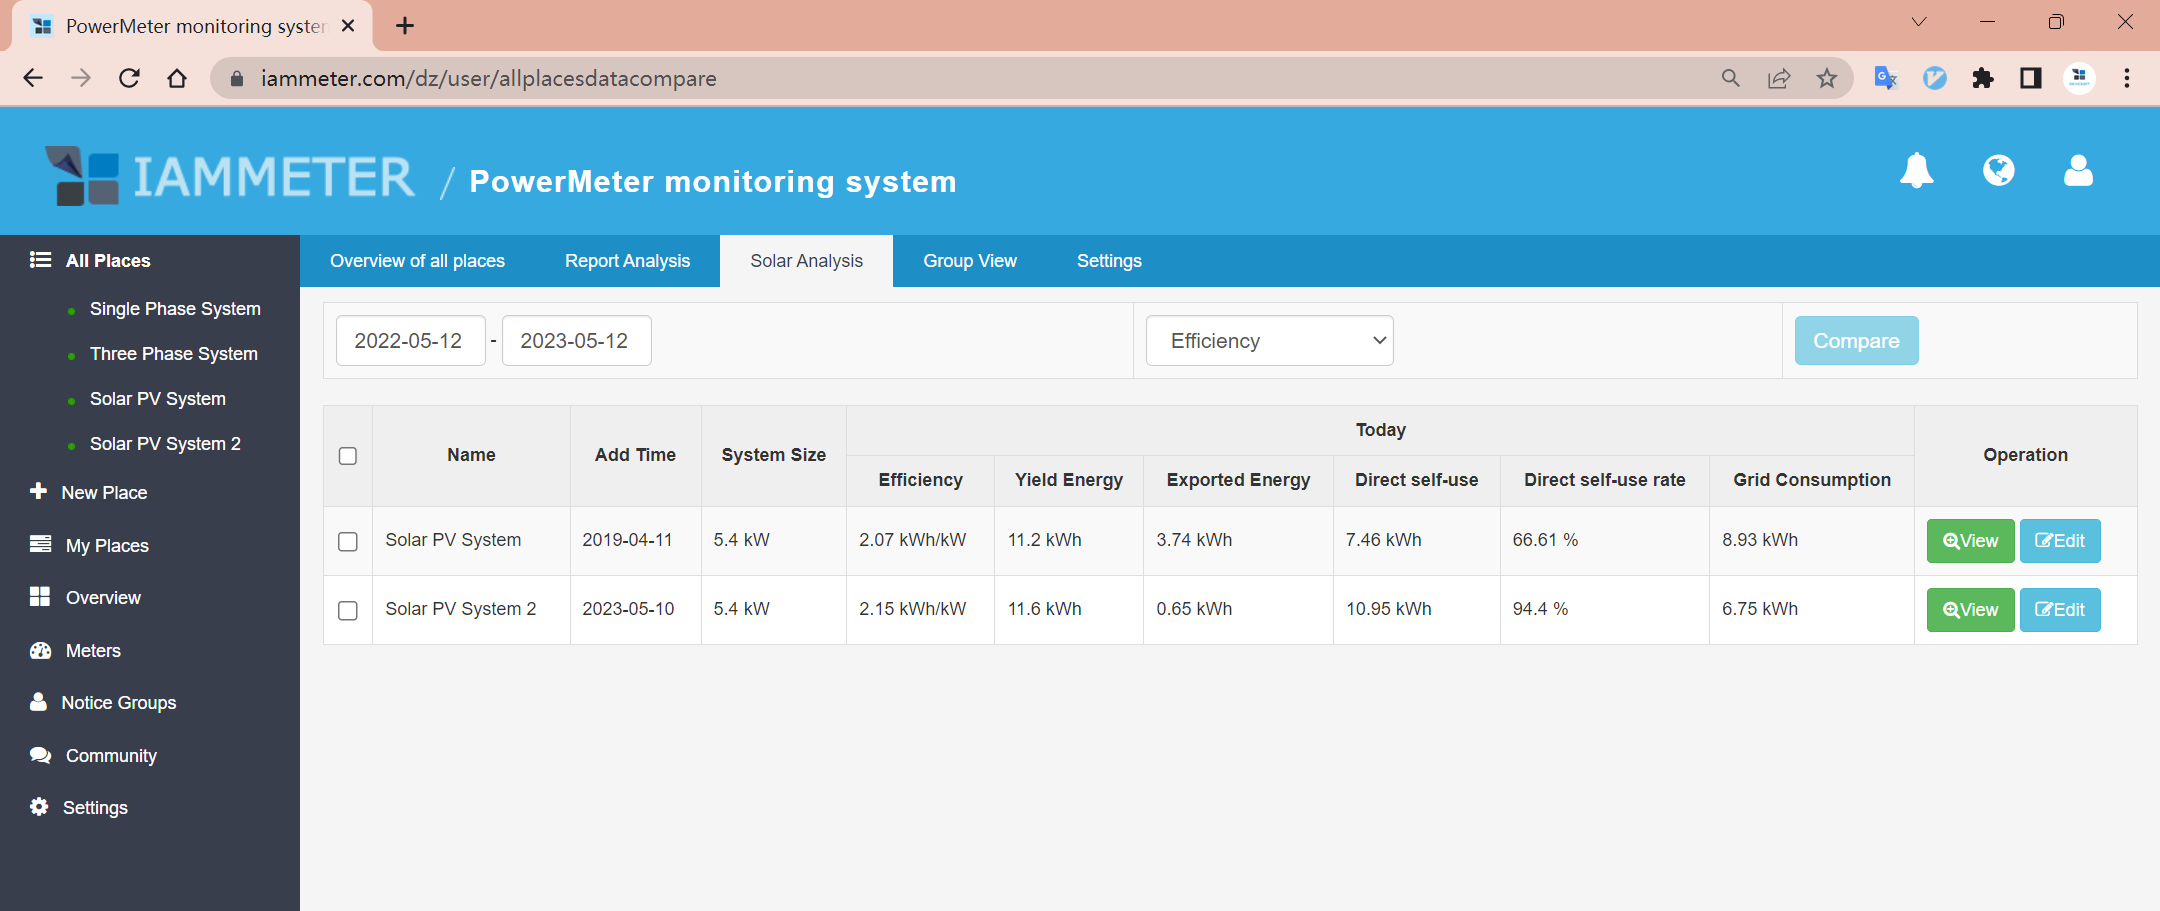
The main page shows all the daily parameters of the solar PV site
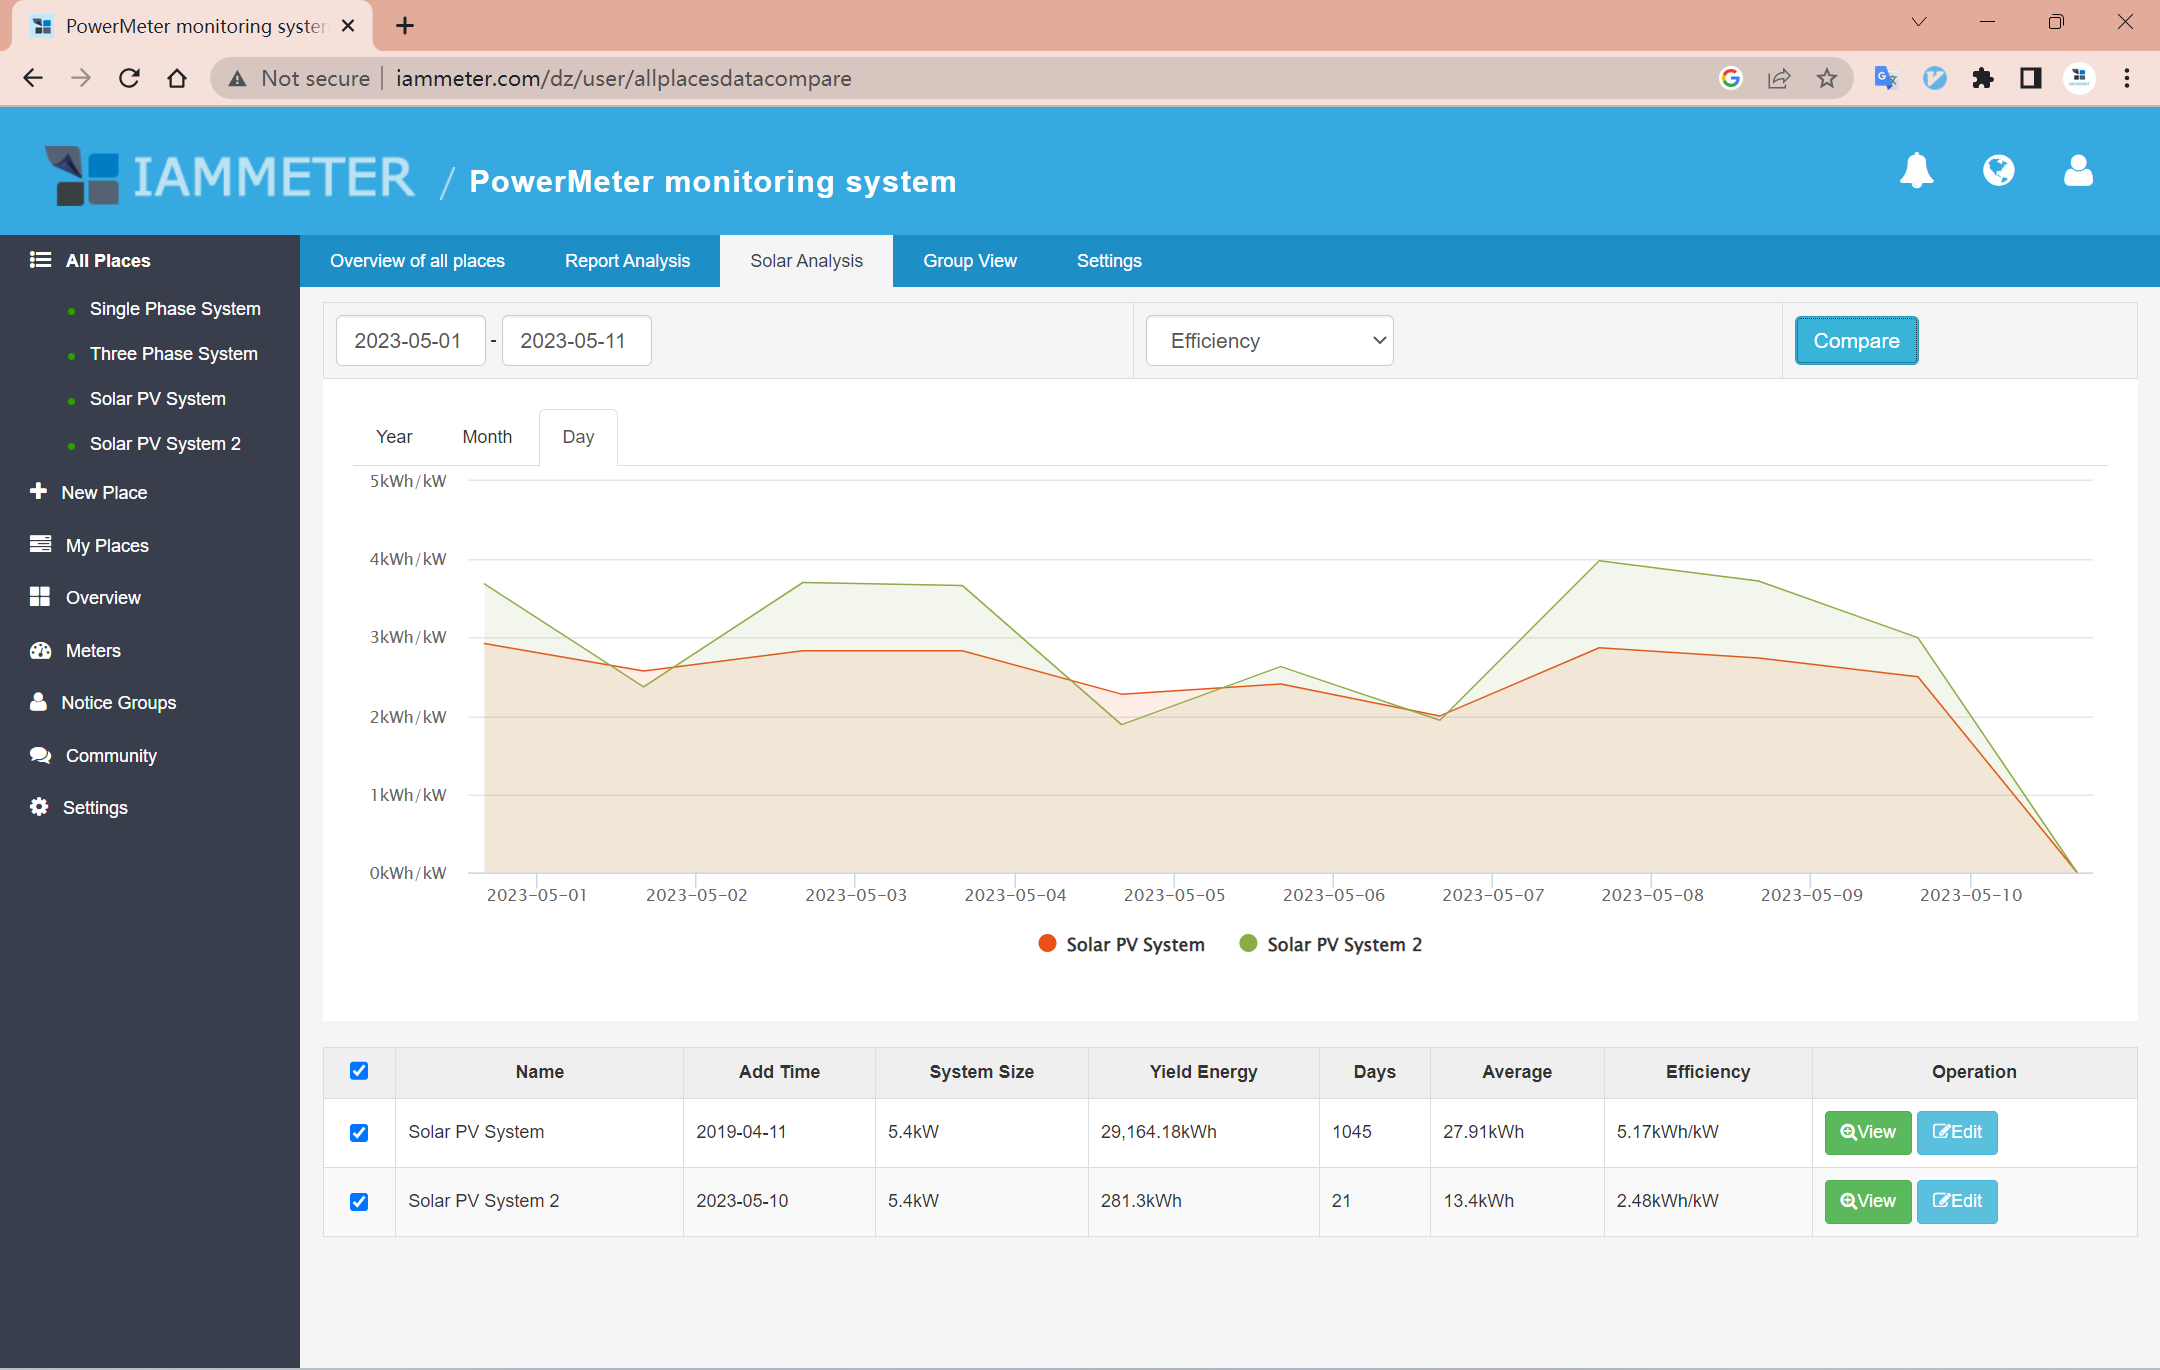
Comparison of the efficiency
The points of Y-axis in the graph represent the daily efficiency of each site.
The definition of the solar PV efficiency
efficiency = total solar yield energy/(Days*system size)
Add the parameter of solar PV efficiency in IAMMETER-cloud
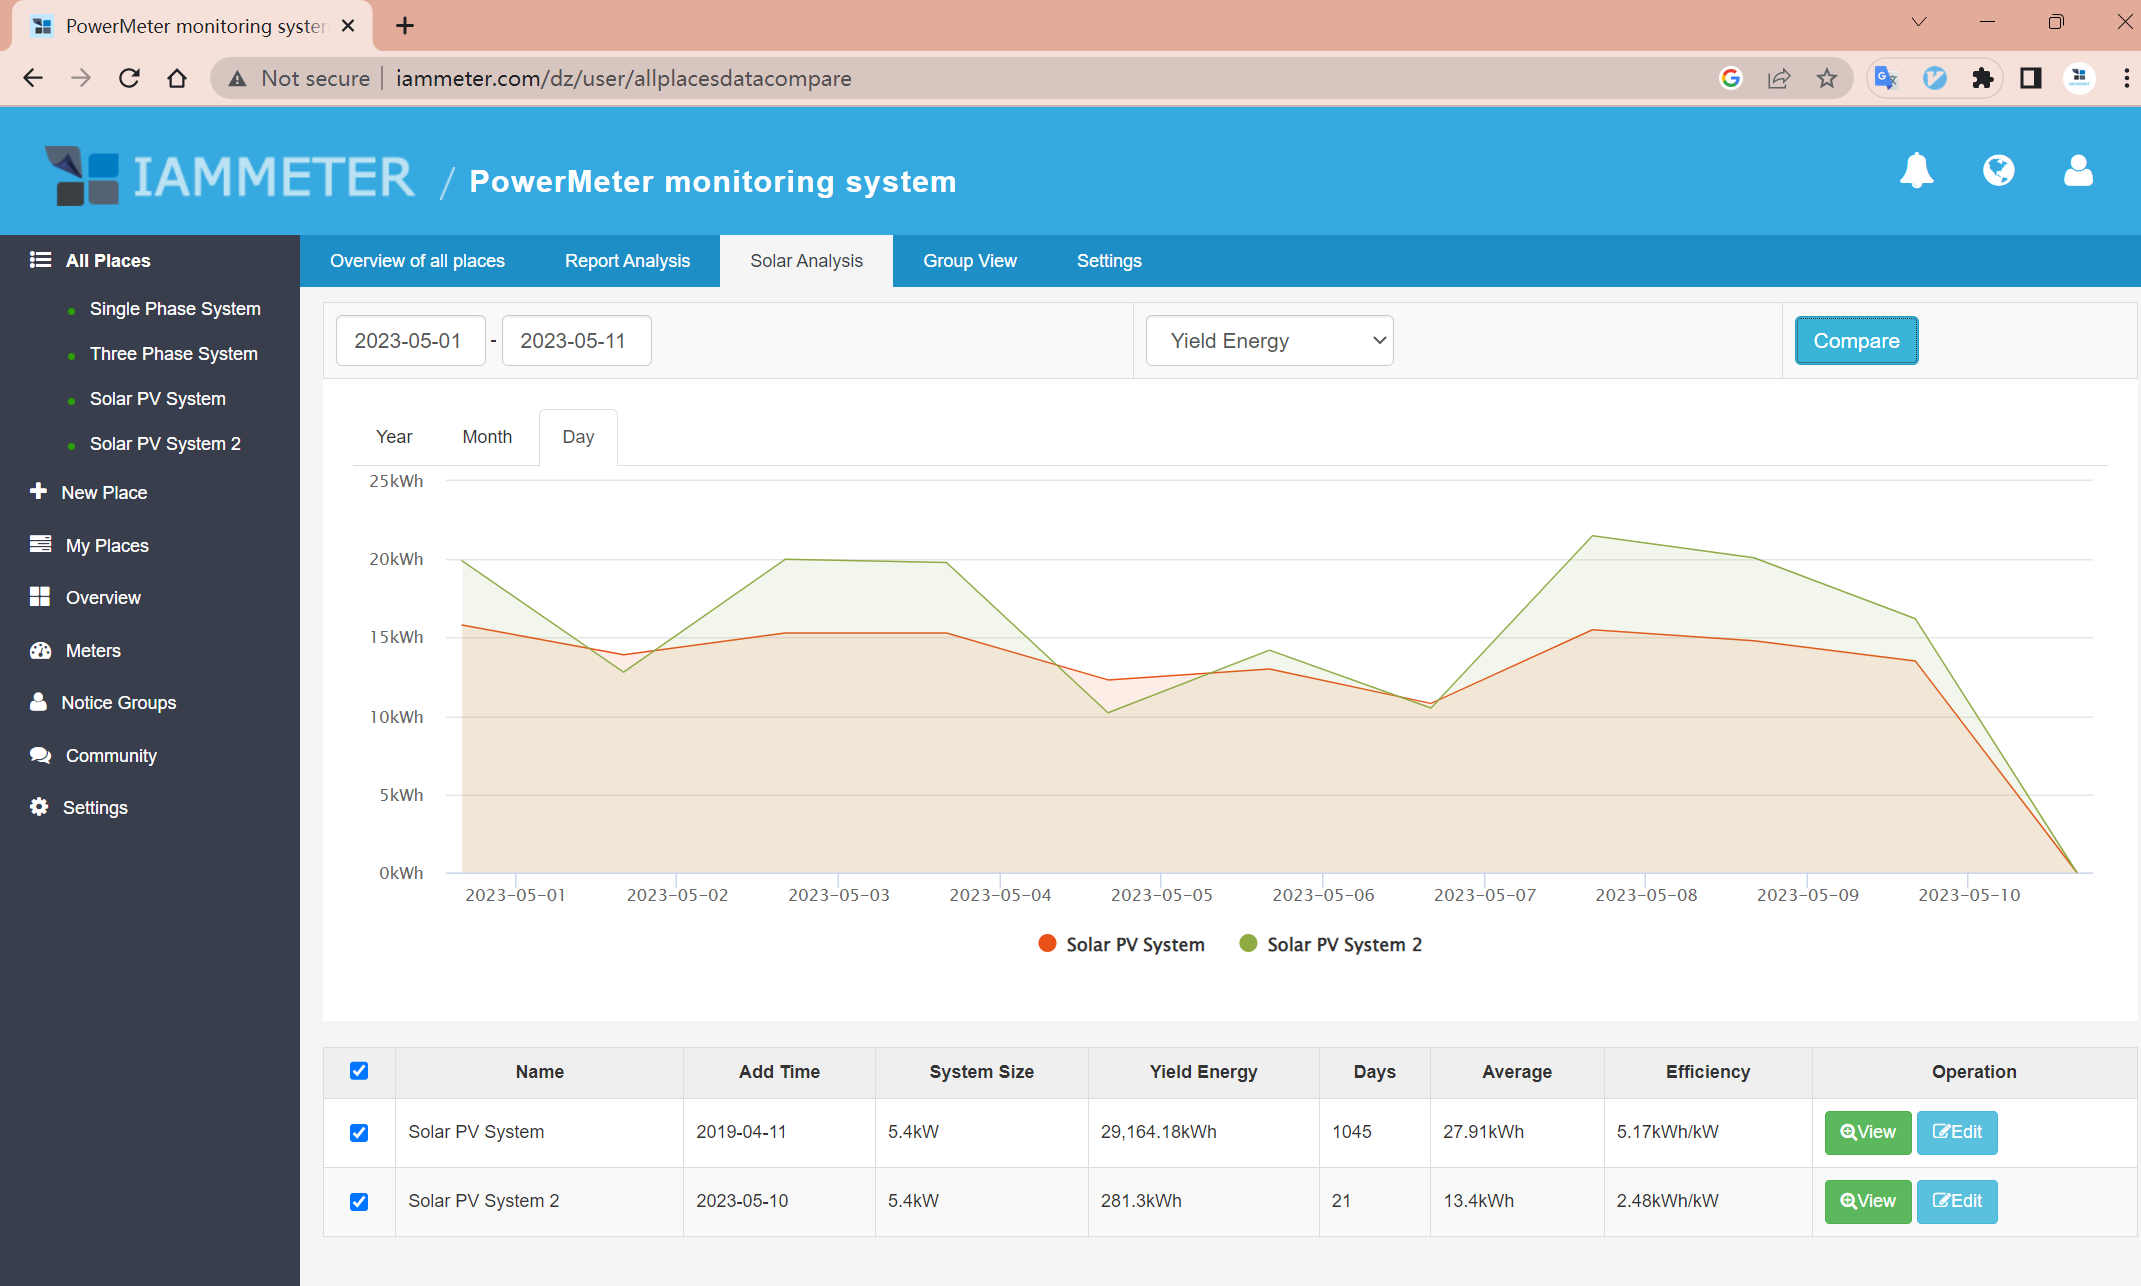
Comparison of the Yield energy (kWh)
The points of Y-axis in the graph represent the daily Yield energy (kWh) of each site.
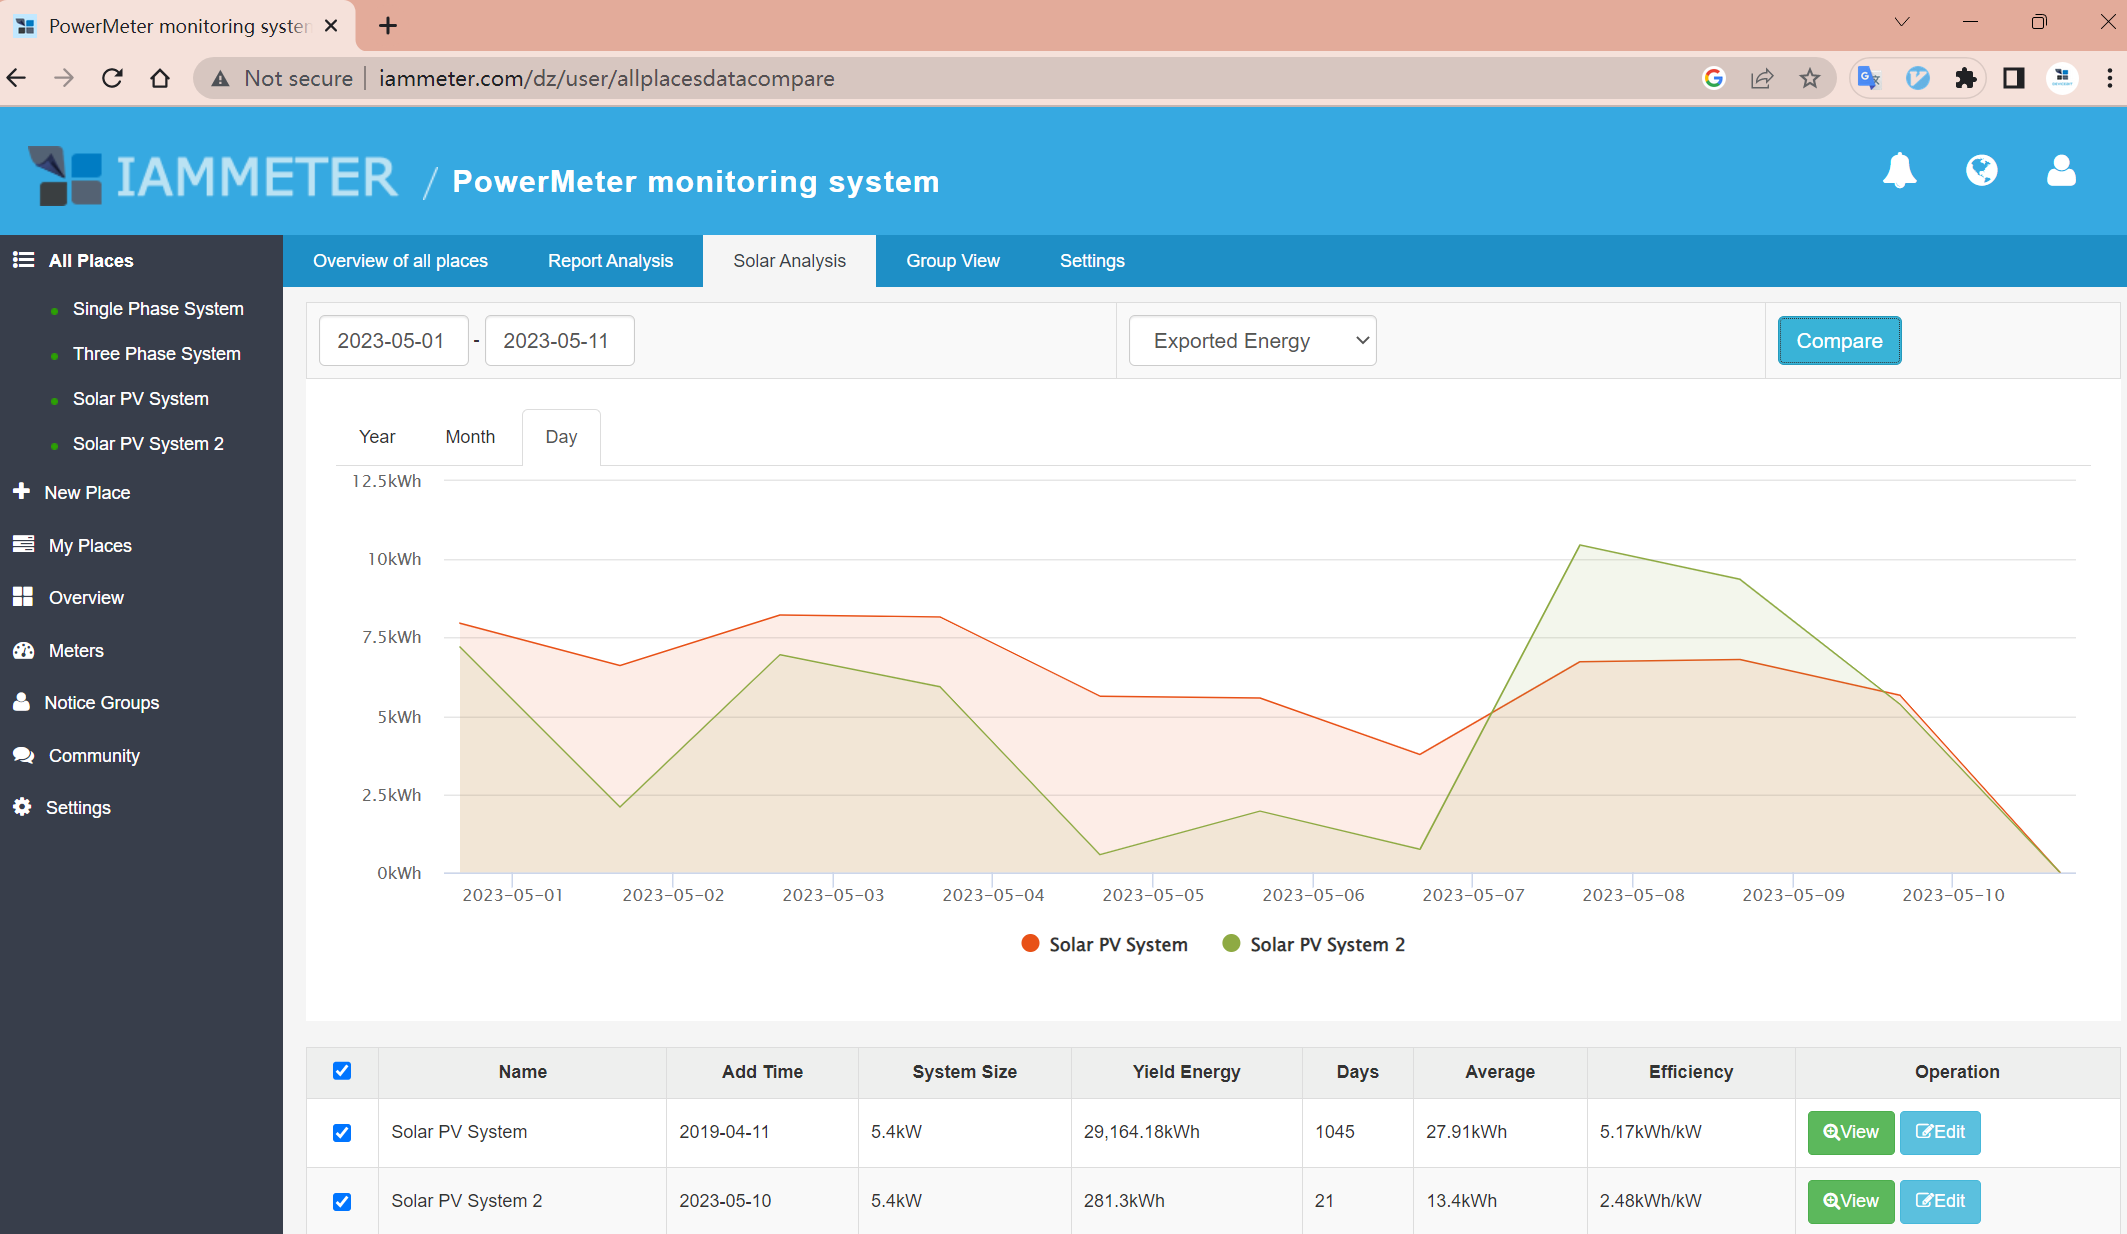
Comparison of the exported energy (kWh)
The points of Y-axis in the graph represent the daily exported energy (kWh) of each solar site.
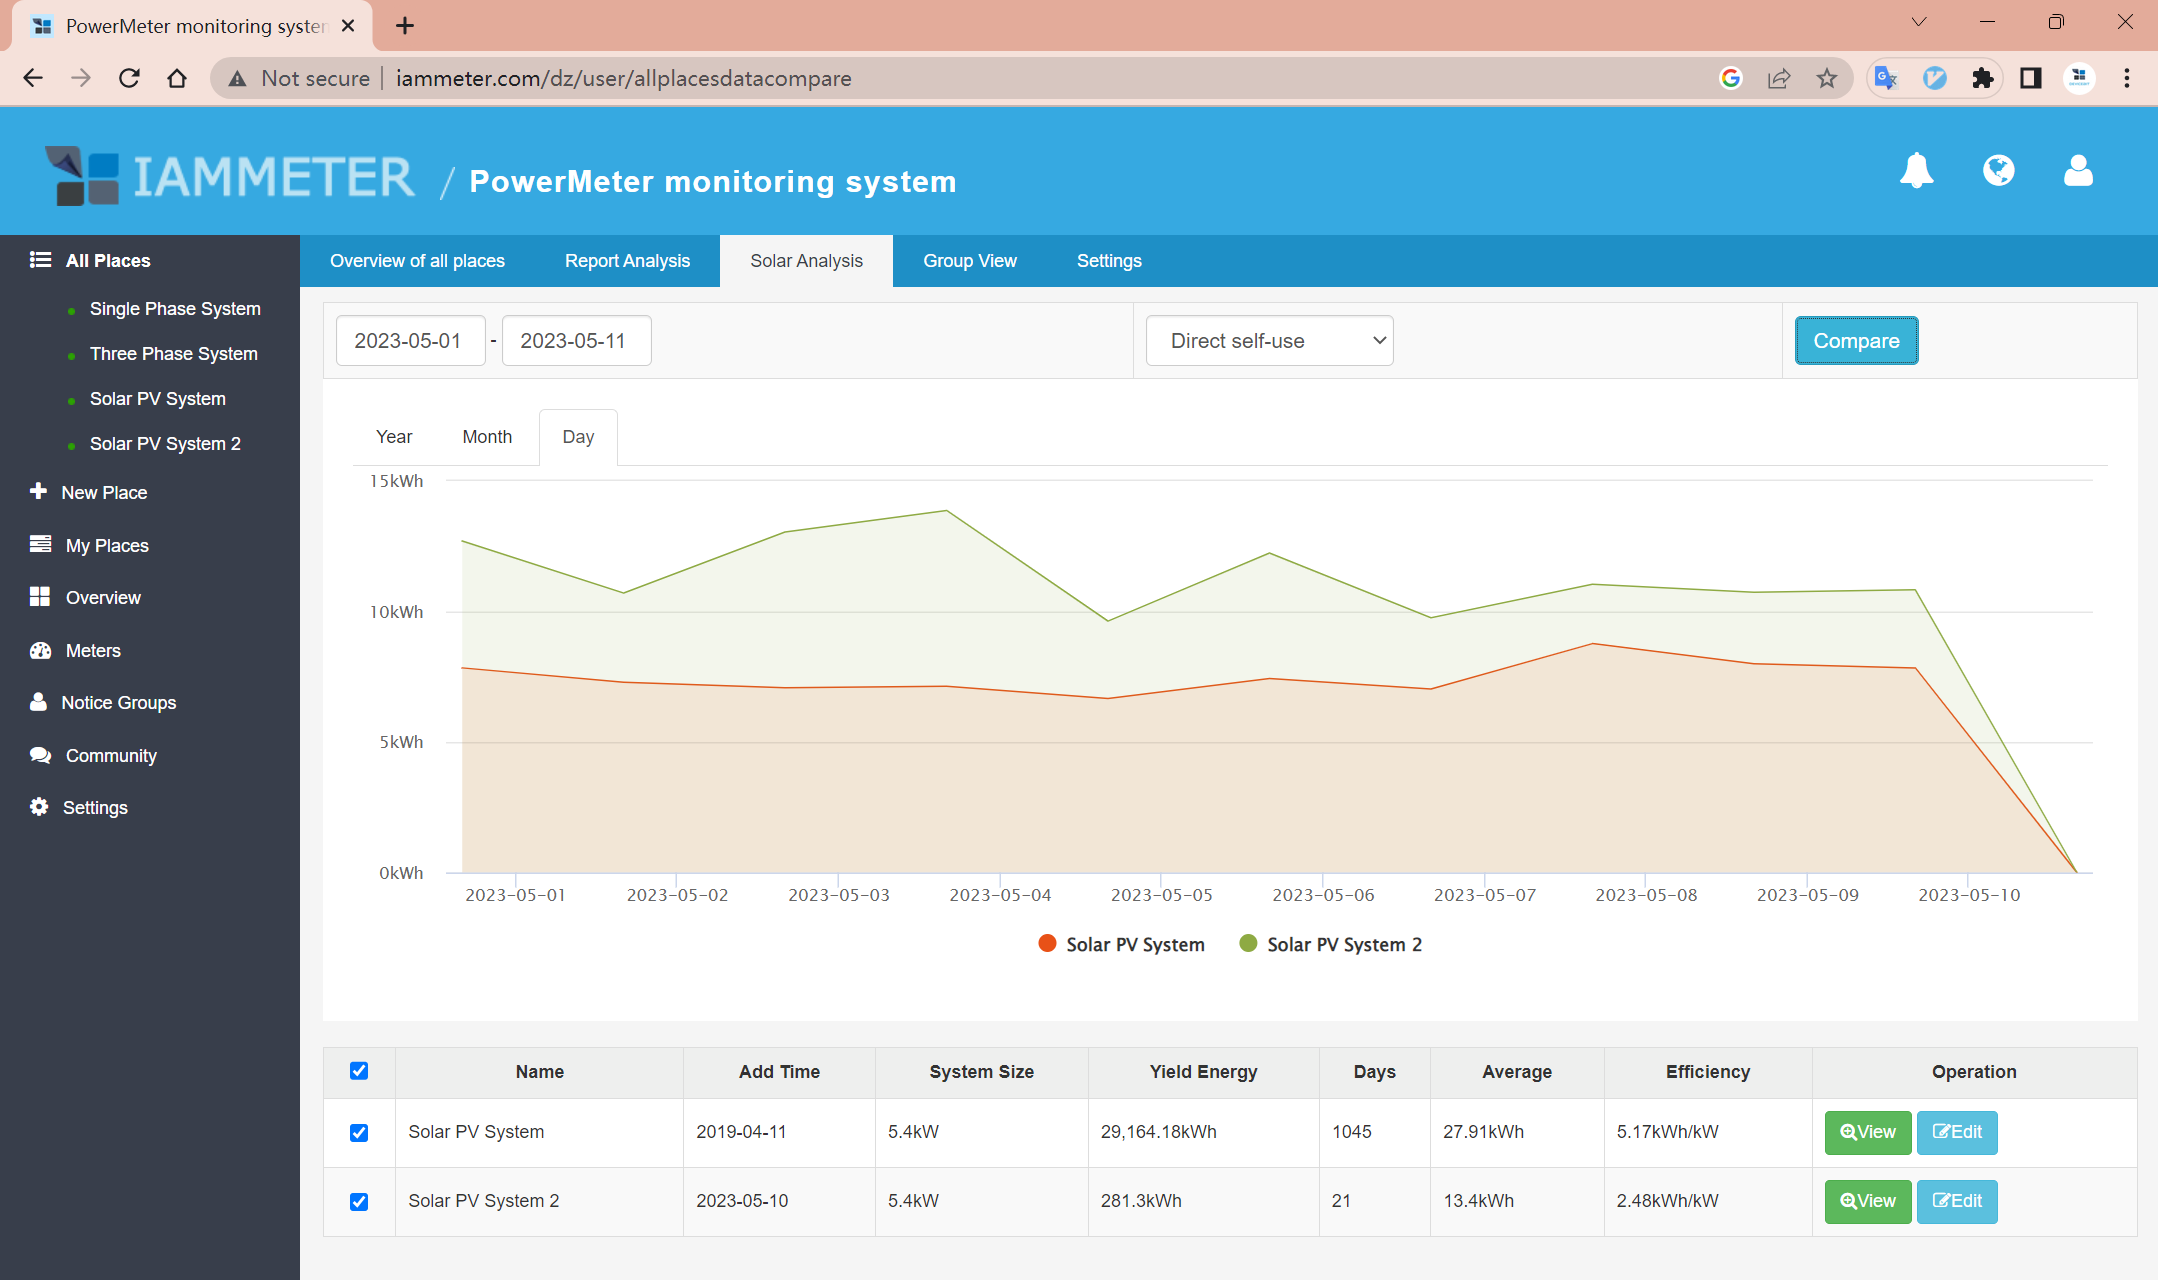
Comparison of the Direct self use (kWh)
The points of Y-axis in the graph represent the daily direct self use (kWh) of each solar site.
Direct self-use (kWh) = Yield Energy - Exported Energy
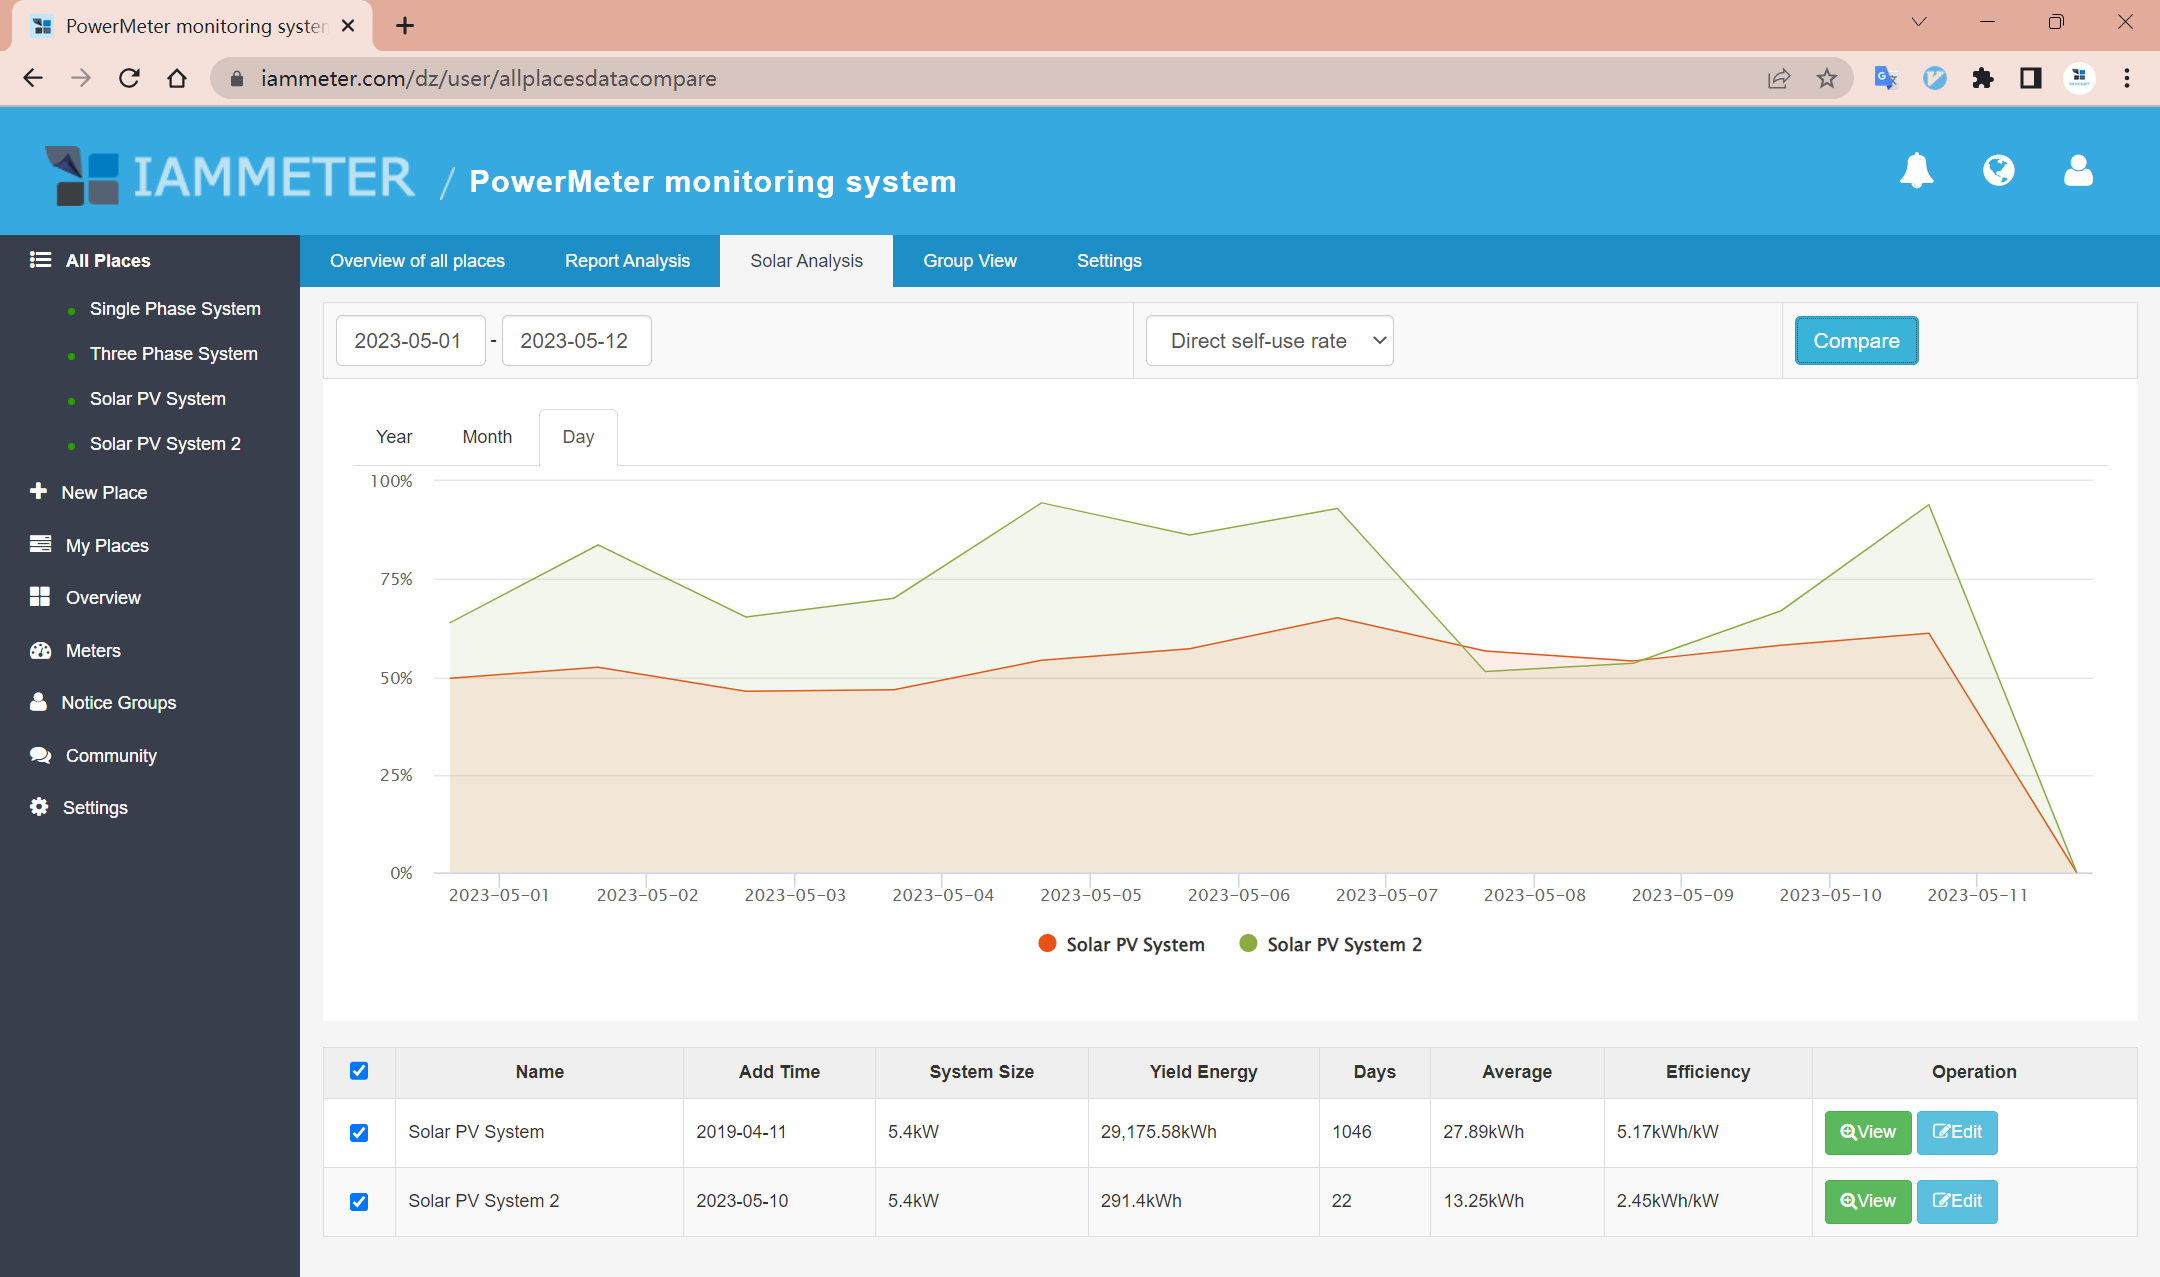
Comparison of the Direct self use rate
The points of Y-axis in the graph represent the daily direct self use rate of each solar site.
Direct self-use rate = Direct self-use energy / Yield energy
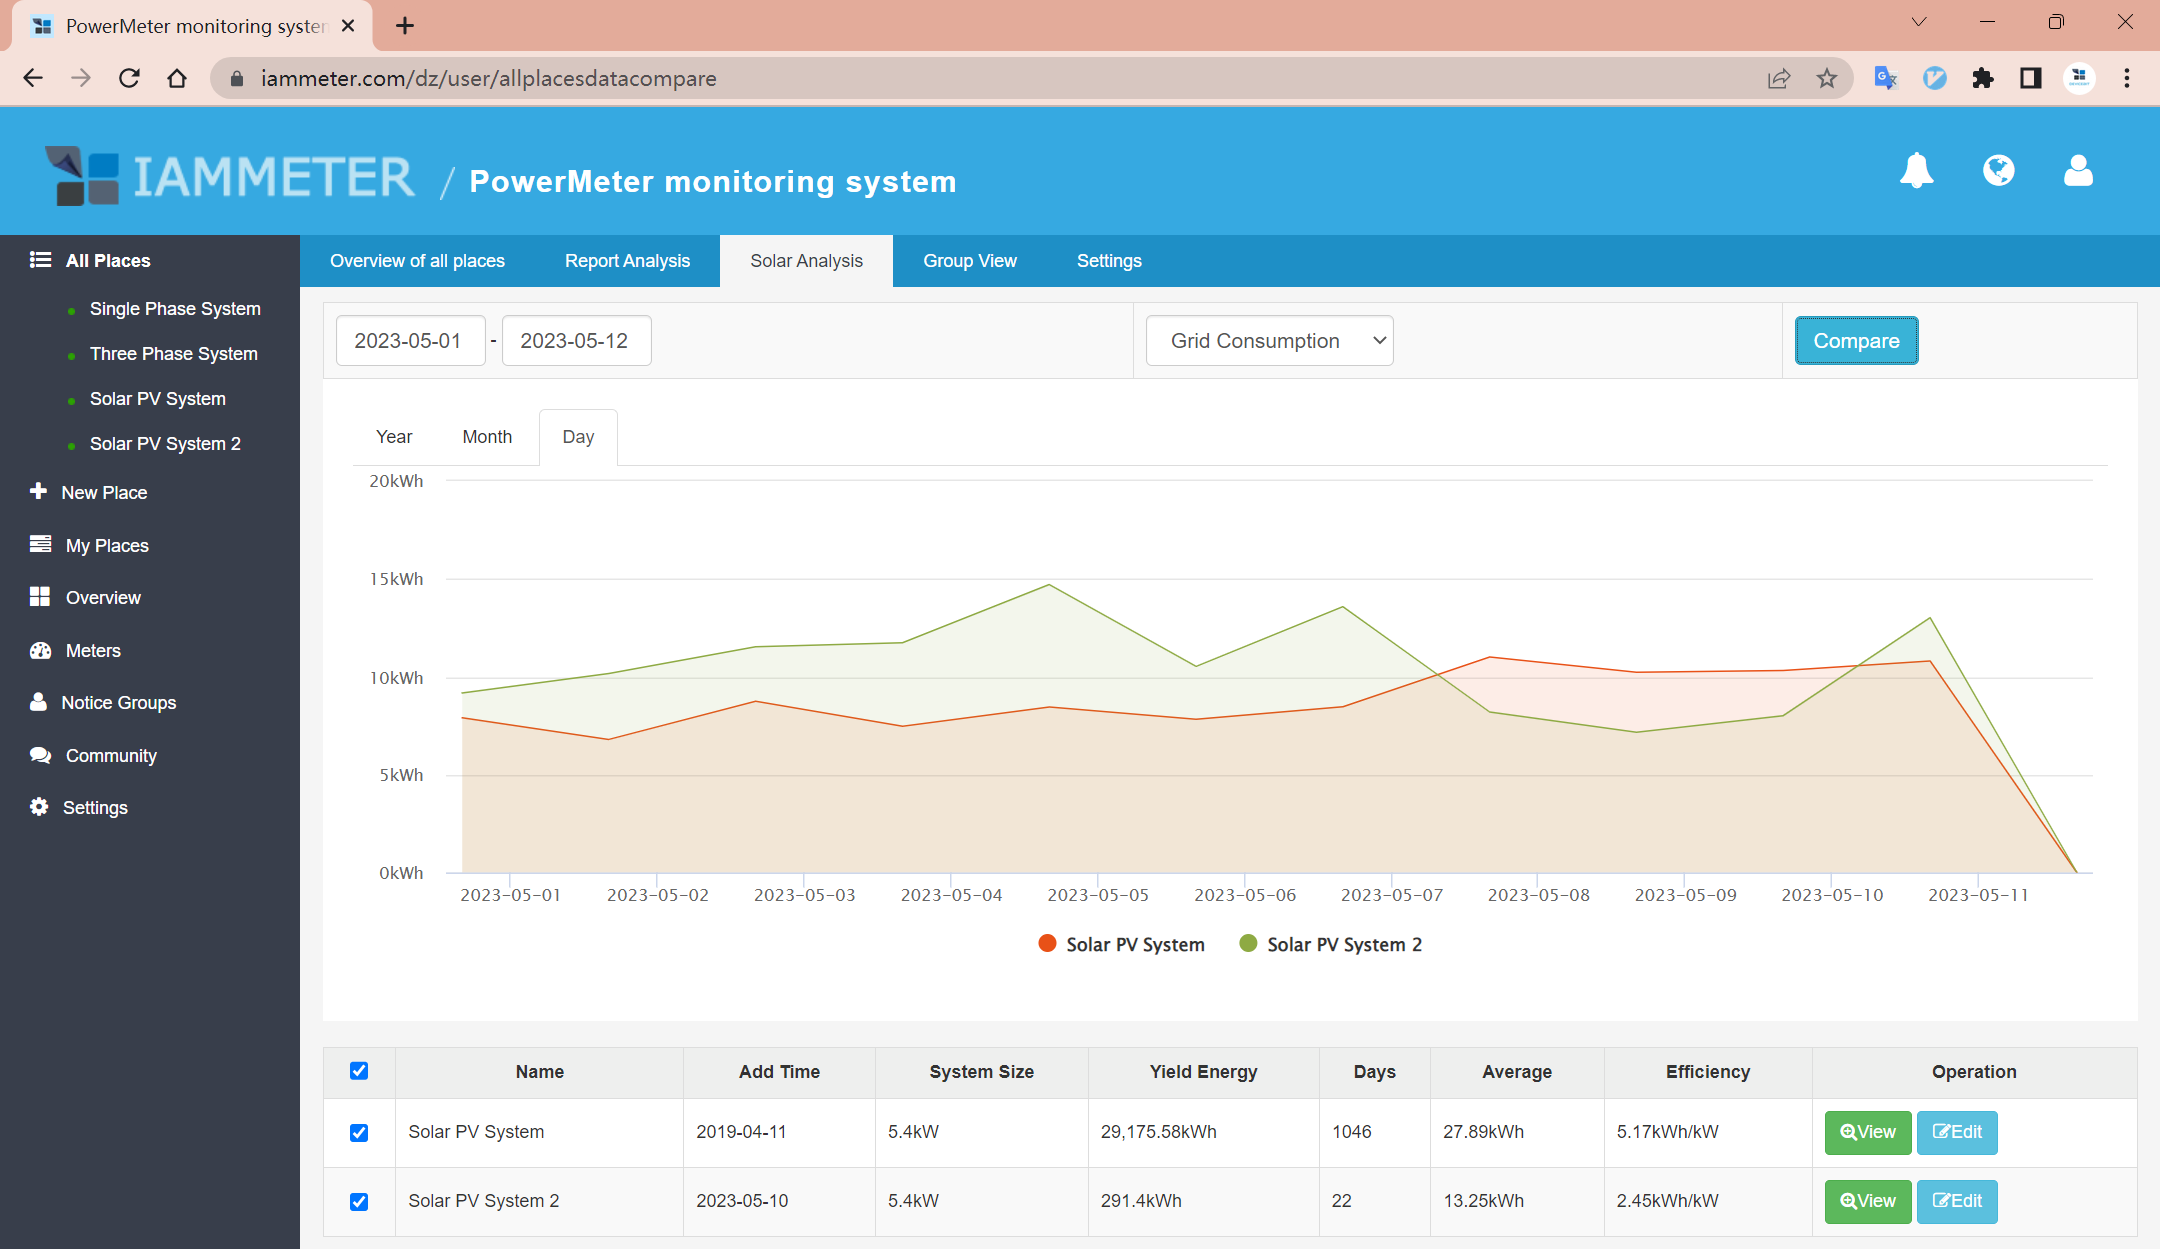
Comparison of the Grid consumption
The points of Y-axis in the graph represent the daily grid consumption(kWh) of each solar site.
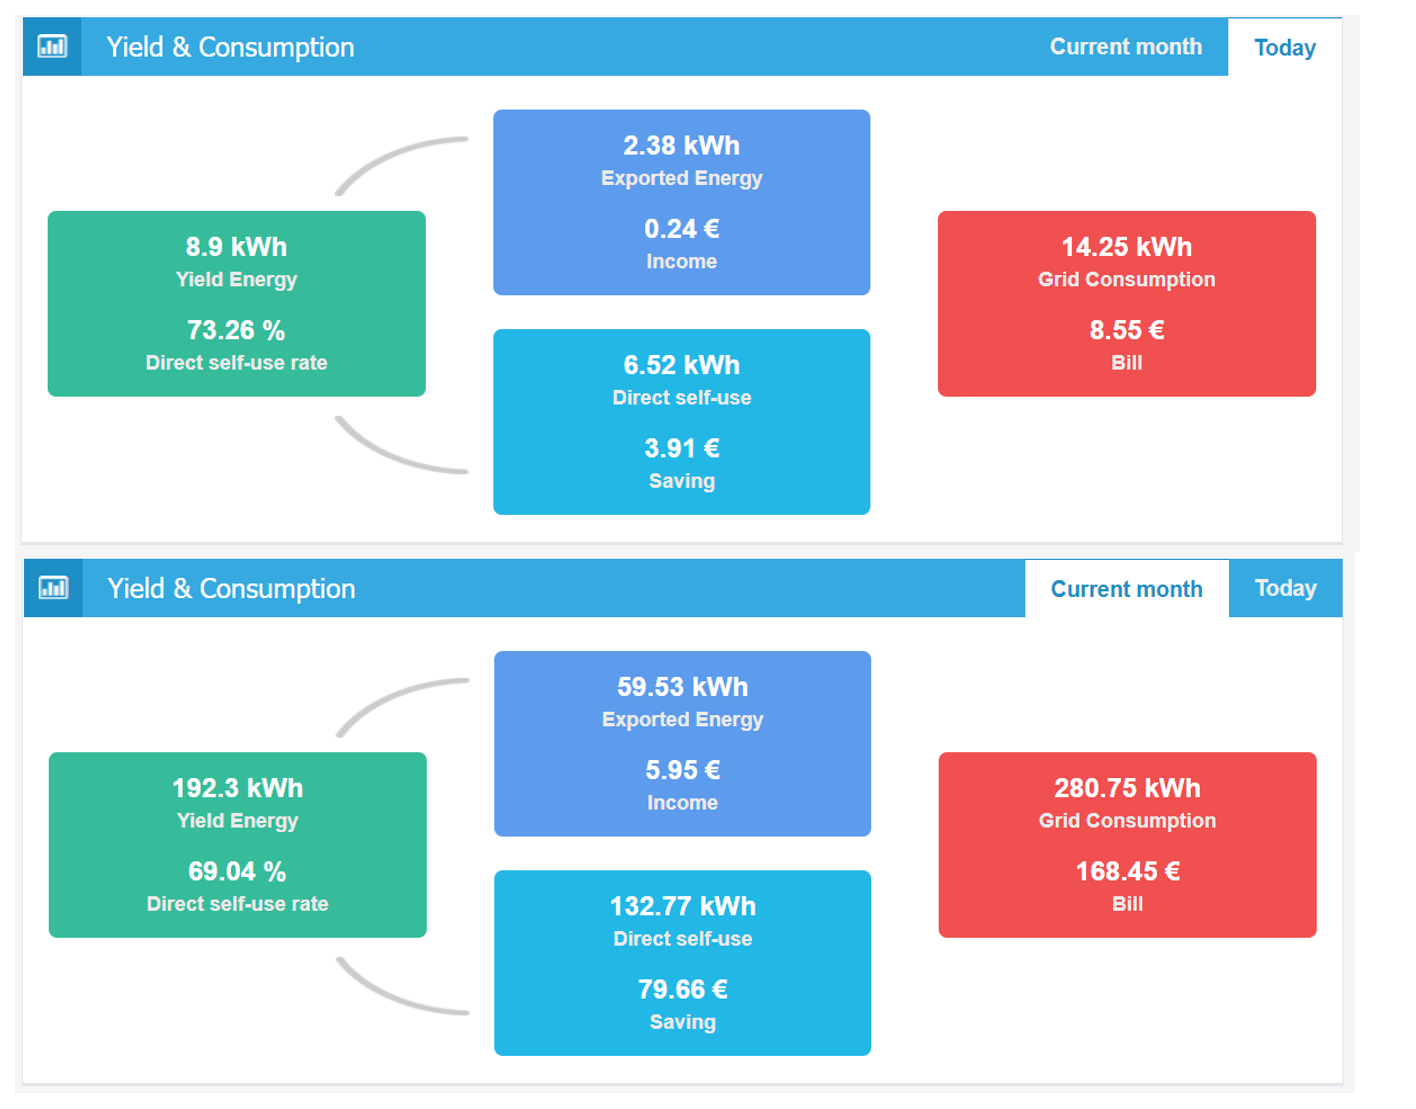
Summary of the parameters in solar PV site
In fact, all of the parameters have already been listed in the "overview" monitoring page of each place as below.
Introduce the overview page of Solar PV system monitoring
Reference
New Feature: Add the parameter of solar PV efficiency in IAMMETER-cloud


")
")