


Your electricity bill tells you how much energy the home used and how much you need to pay. It does not show when the electricity was used, what caused a peak, or whether a load ran longer than expected.
An electricity usage monitor for home measures electricity at the electrical panel and records the results continuously. Instead of waiting for the next bill, you can see:
IAMMETER combines a Wi-Fi energy meter with IAMMETER-Cloud and open local integrations. It can be used for single-phase, split-phase and three-phase homes.
Looking for products, meter selection and purchasing information? Visit the complete Home Energy Monitoring Solution.
A monthly total cannot explain the pattern behind the cost.
For example, two homes may both consume 600 kWh in one month, but the causes can be very different:
Continuous monitoring adds time to the energy data. This makes it possible to ask better questions:
A panel-installed meter measures electrical values for the whole supply or for selected conductors.
| Measurement | What it tells you |
|---|---|
| Real-time power | How much electricity the home is using now |
| Energy in kWh | How much electricity was used over a period |
| Voltage and current | Basic electrical conditions at the measurement point |
| Import energy | Electricity taken from the utility grid |
| Estimated cost | The value of measured consumption using configured tariffs |
| Peak power | The highest demand during the selected period |
These tools solve different problems.
| Monitoring method | Best for | Main limitation |
|---|---|---|
| Whole-home panel meter | Total home consumption, peaks, trends and billing | Does not automatically identify every appliance from one measurement point |
| Smart plug | One plug-in appliance | Cannot monitor hardwired loads or the whole home |
| Dedicated sub-meter | A major circuit such as a heat pump or water heater | Requires an additional measurement channel and installation point |
| Utility smart meter | Official billing and cumulative usage | Data access and refresh rate depend on the utility |
A whole-home meter is the starting point for understanding the overall pattern. If one circuit needs separate measurement, use an additional channel or sub-meter for that load.
The overview dashboard shows the current electrical load and key measurements. Switching a major appliance on or off should produce a visible change in power.
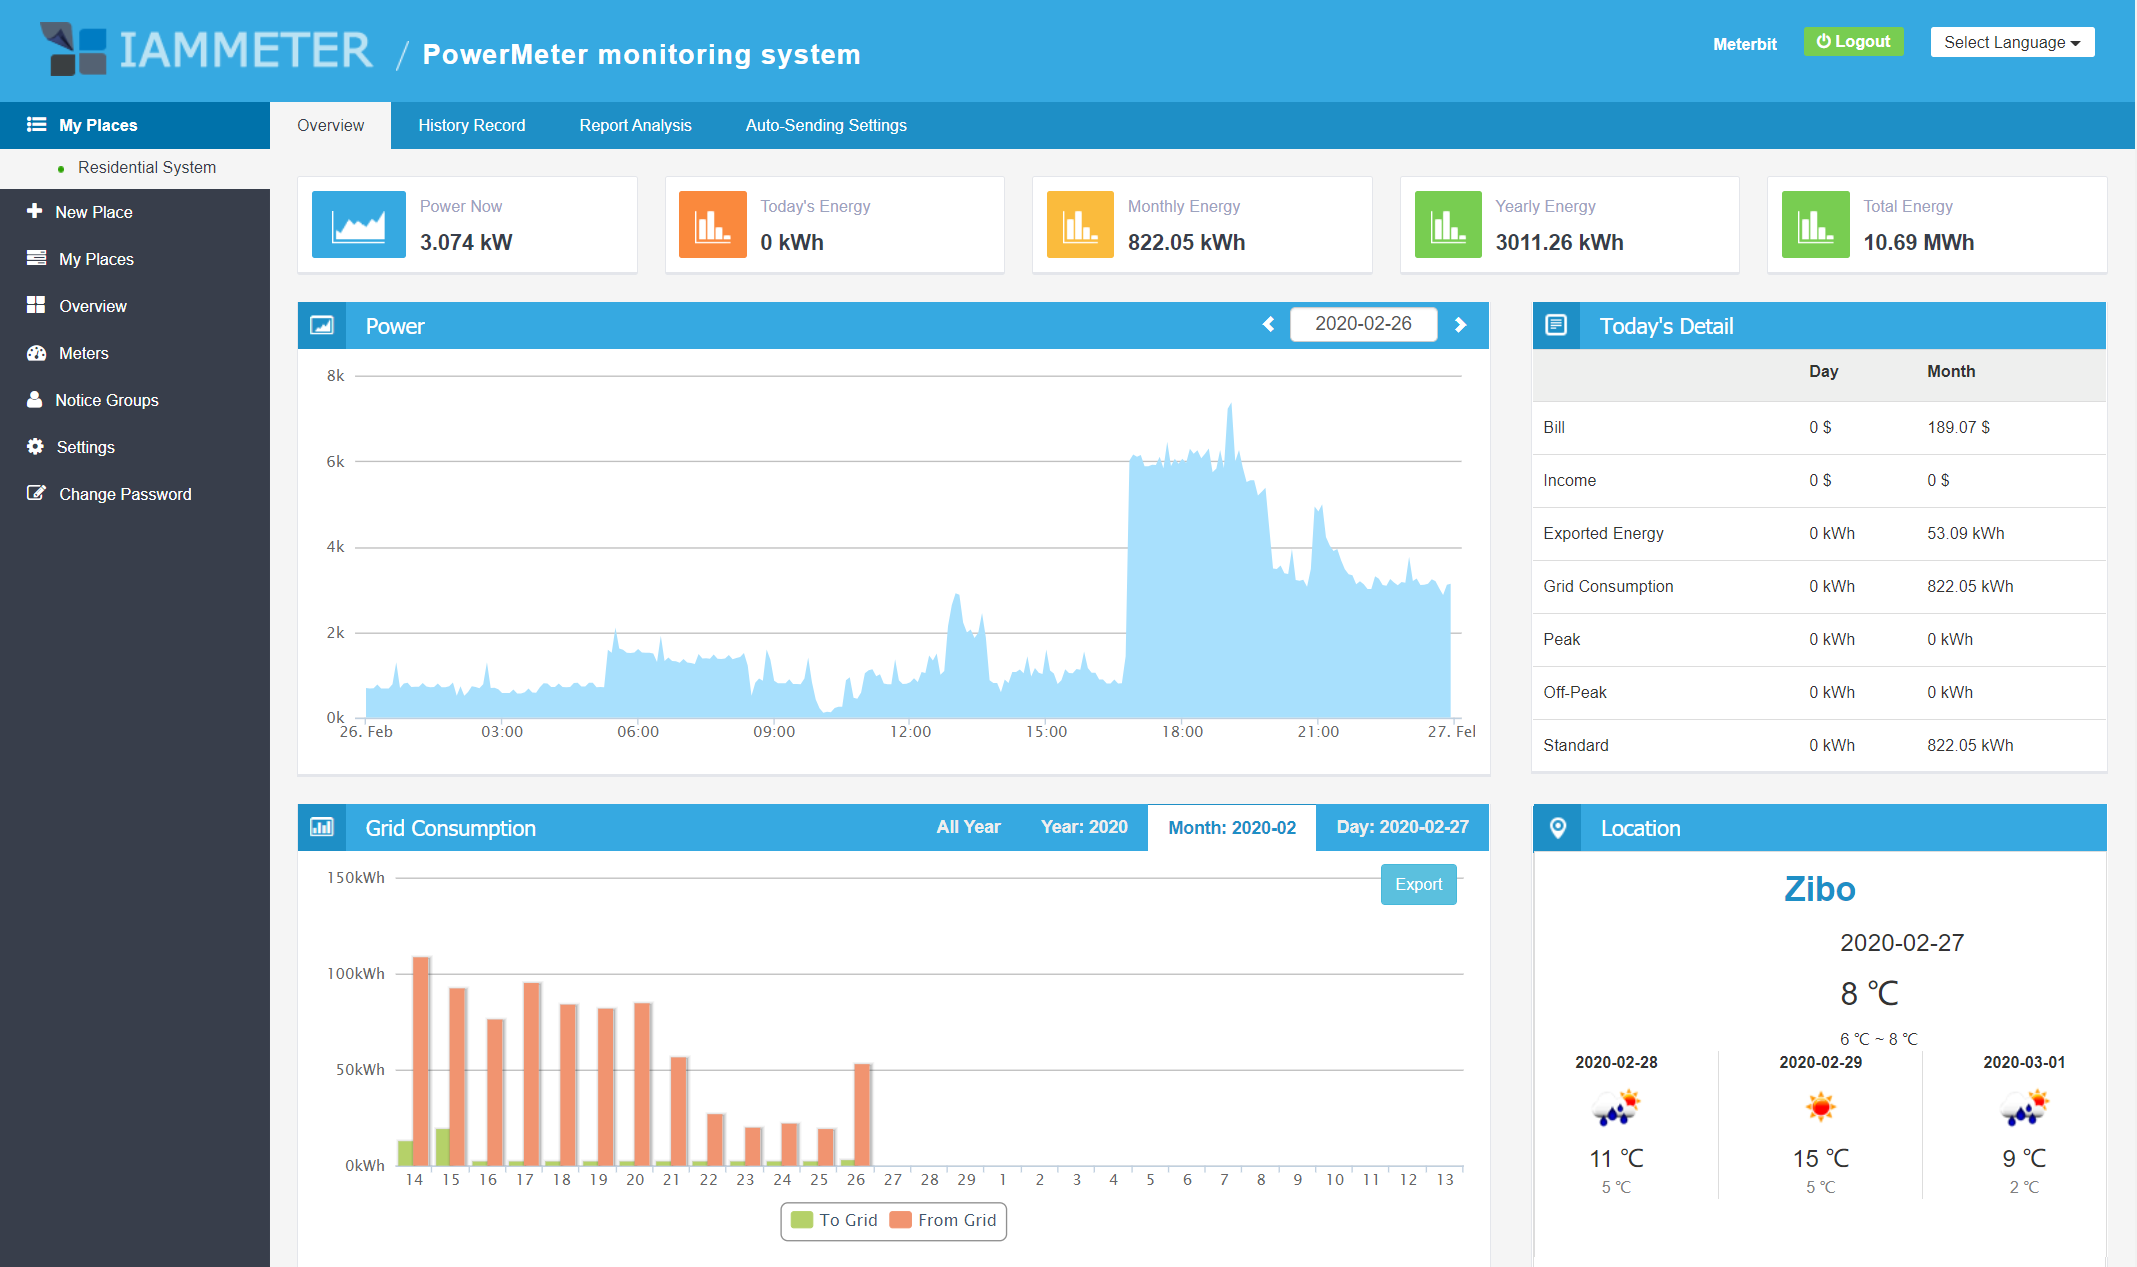
Real-time power is useful for quick checks, but one instant reading is not enough to explain a bill. Historical kWh and time-based analysis provide the longer-term picture.
IAMMETER records energy consumption and can estimate electricity cost using the configured tariff and billing period.
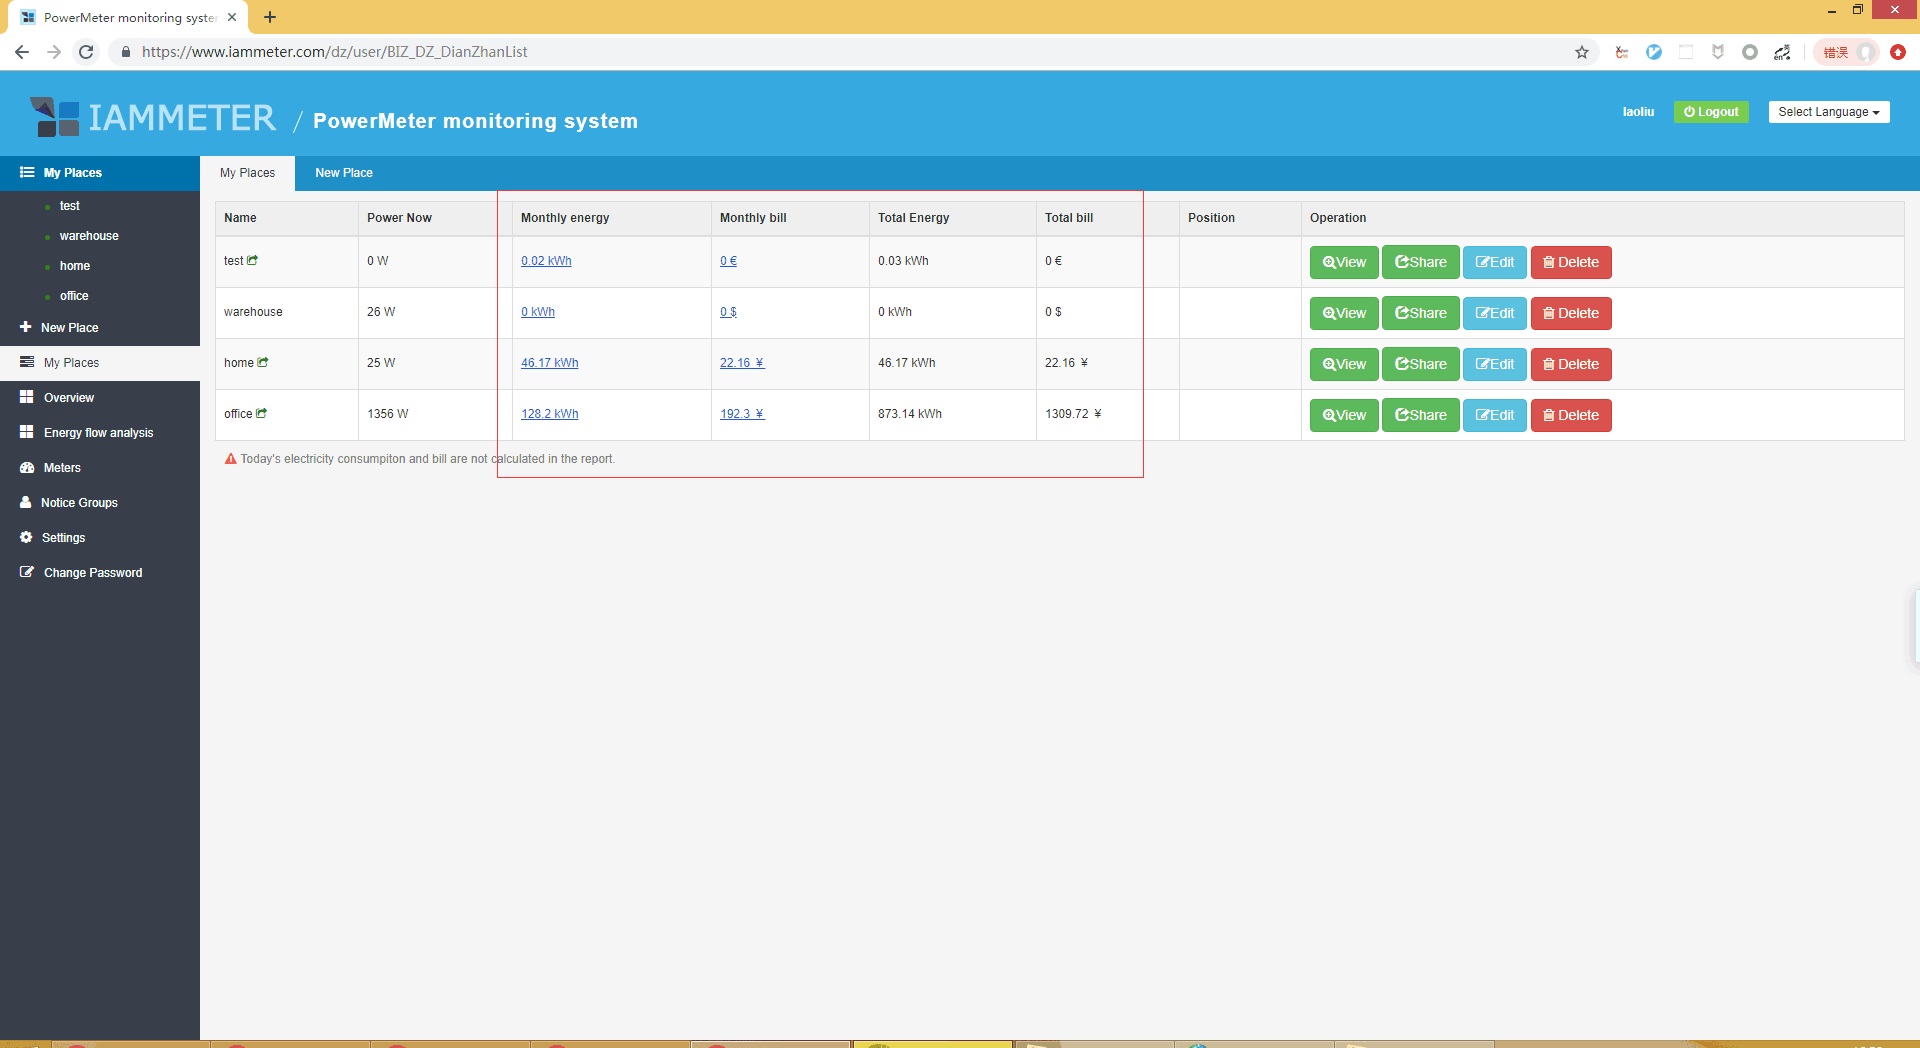
You can configure the billing date when the utility billing cycle does not begin on the first day of the month.
Time-based reports help reveal:
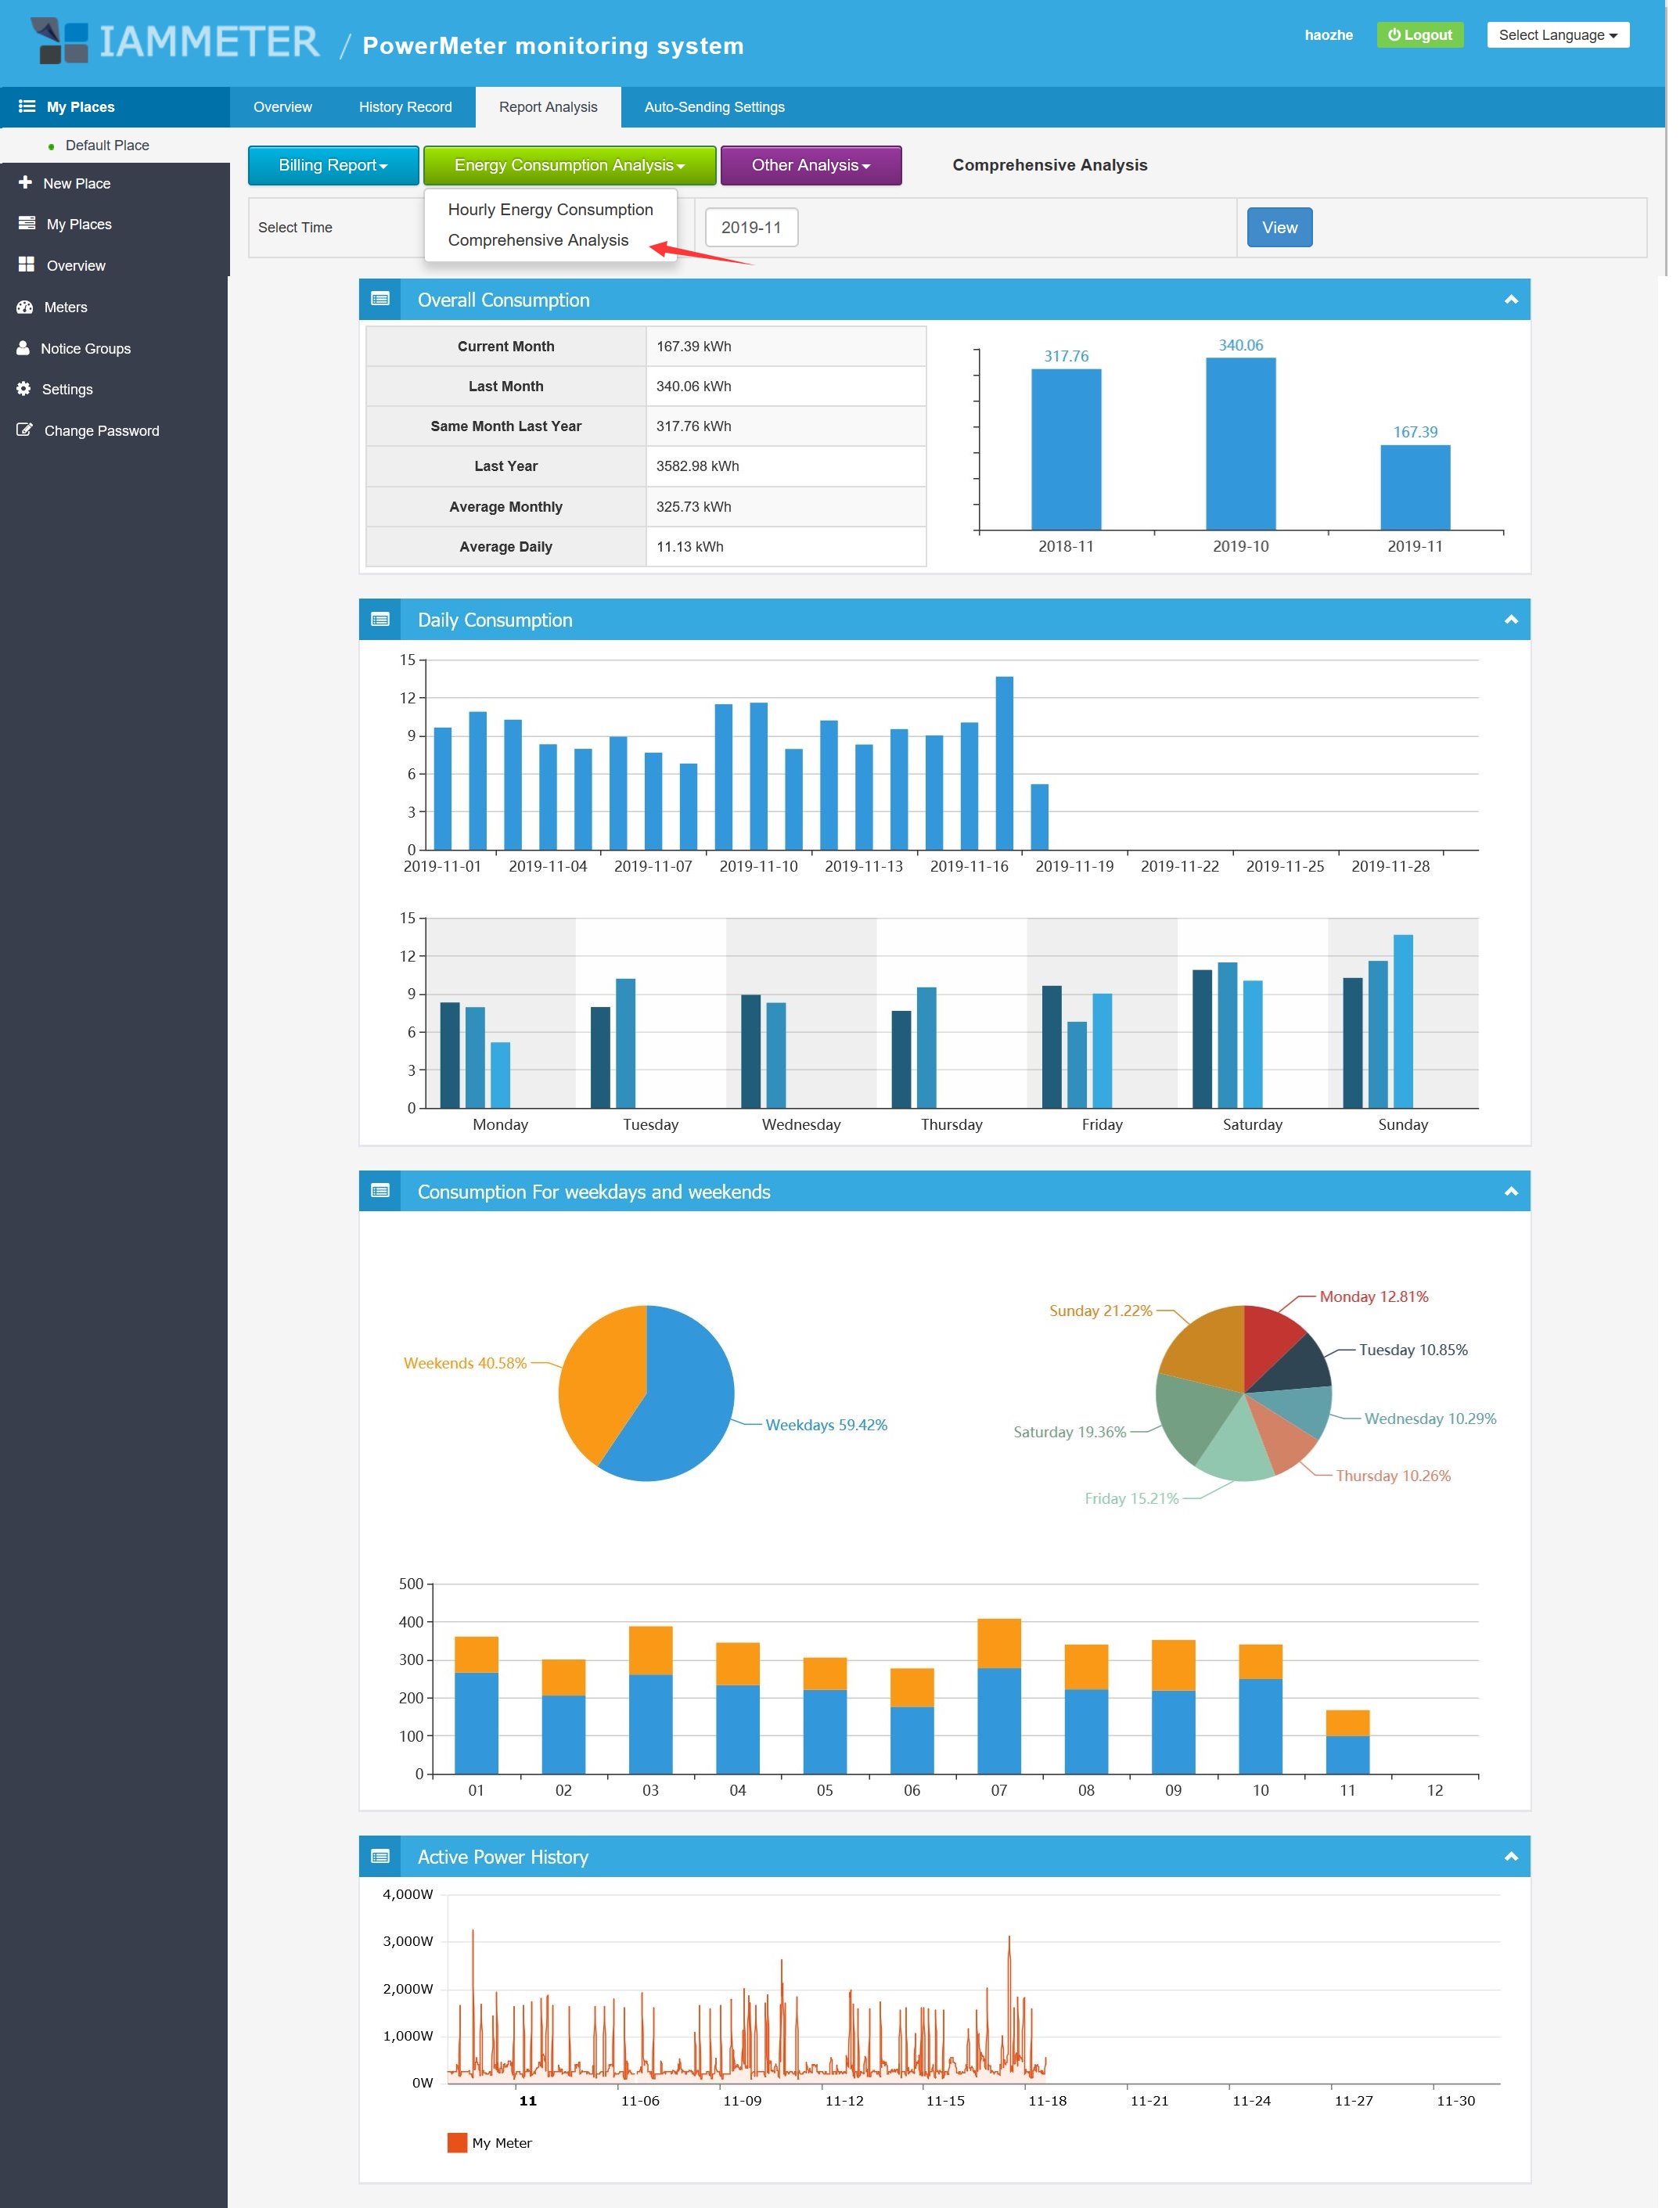
For more examples, see Energy Consumption Analysis with IAMMETER.
Monitoring is most useful when it supports a decision. A simple process is:
Examples include changing a water-heating schedule, reducing unnecessary standby load, moving flexible loads away from peak tariffs, or correcting equipment that runs outside its intended hours.
The monitoring path has four parts:
Installation should be performed at the correct measurement point and with the correct CT direction. After installation, validate the readings by switching a known load and checking that power changes in the expected direction.
The electrical system determines the appropriate meter. IAMMETER's primary residential choices are:
| Home electrical system | Residential model | Typical monitoring goal |
|---|---|---|
| Single-phase | WEM3080 | Monitor total home electricity consumption |
| Split-phase | WEM2067 | Monitor both lines of a split-phase residential supply |
| Single-phase with two measurement points | WEM2067 | Monitor the whole home plus a dedicated circuit, or grid plus inverter output |
| Three-phase residential | WEM3050T | Monitor all three phases of a home supply |
This article focuses on residential monitoring. Other IAMMETER three-phase and CT-operated models are intended for commercial or industrial projects.
For detailed product comparison, system boundaries and purchasing options, use the Home Energy Monitoring Solution selector.
The same meter data can support different monitoring preferences.
Use IAMMETER-Cloud for a ready-to-use dashboard, energy history, tariff-based billing, reports and access from web or mobile devices.
Add IAMMETER measurements to Home Assistant for a local smart-home dashboard, Energy Dashboard entities and automations.
IAMMETER supports local interfaces for users who want to read measurements with their own software or a self-hosted platform.
The live IAMMETER demo lets you inspect the dashboard before selecting a meter.
Open the IAMMETER home electricity monitoring demo
Look for:
Start with one question you want the data to answer. Measure a representative baseline, make one change, and use the next report to verify the result.
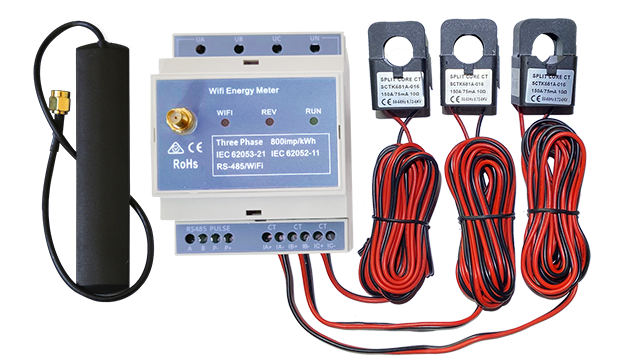
Three Phase Wi-Fi Energy Meter (WEM3080T)
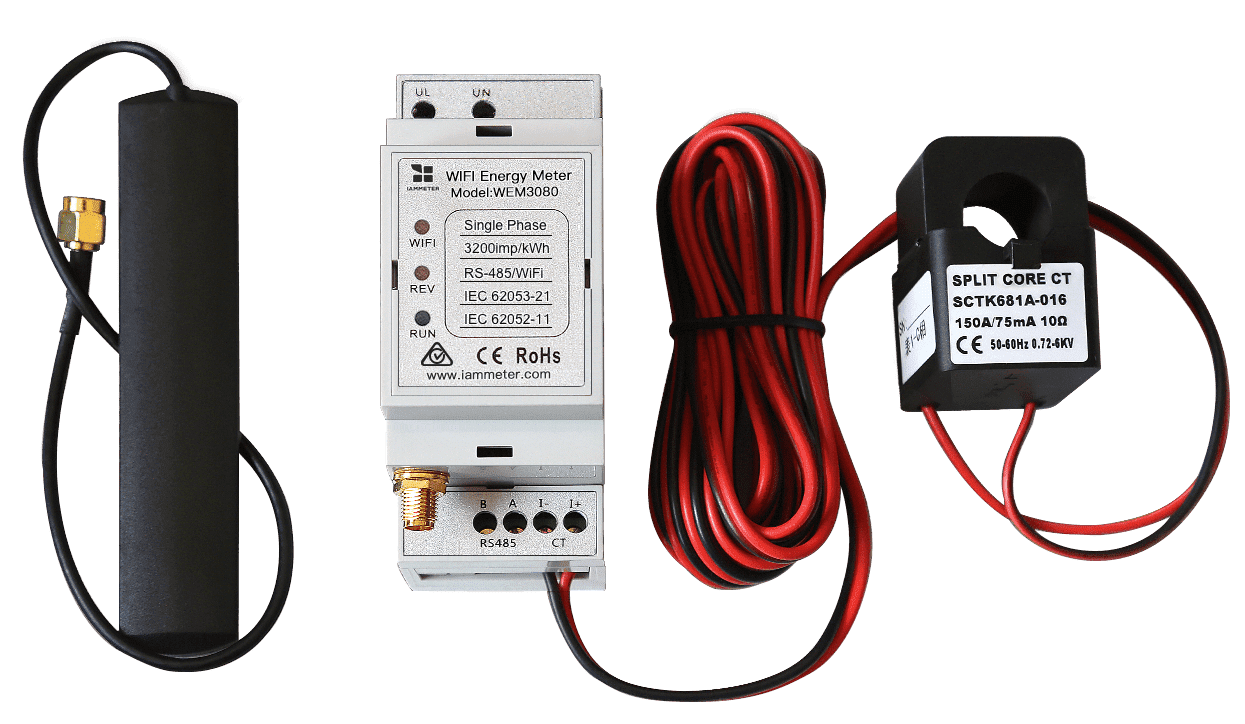
Single Phase Wi-Fi Energy Meter (WEM3080)
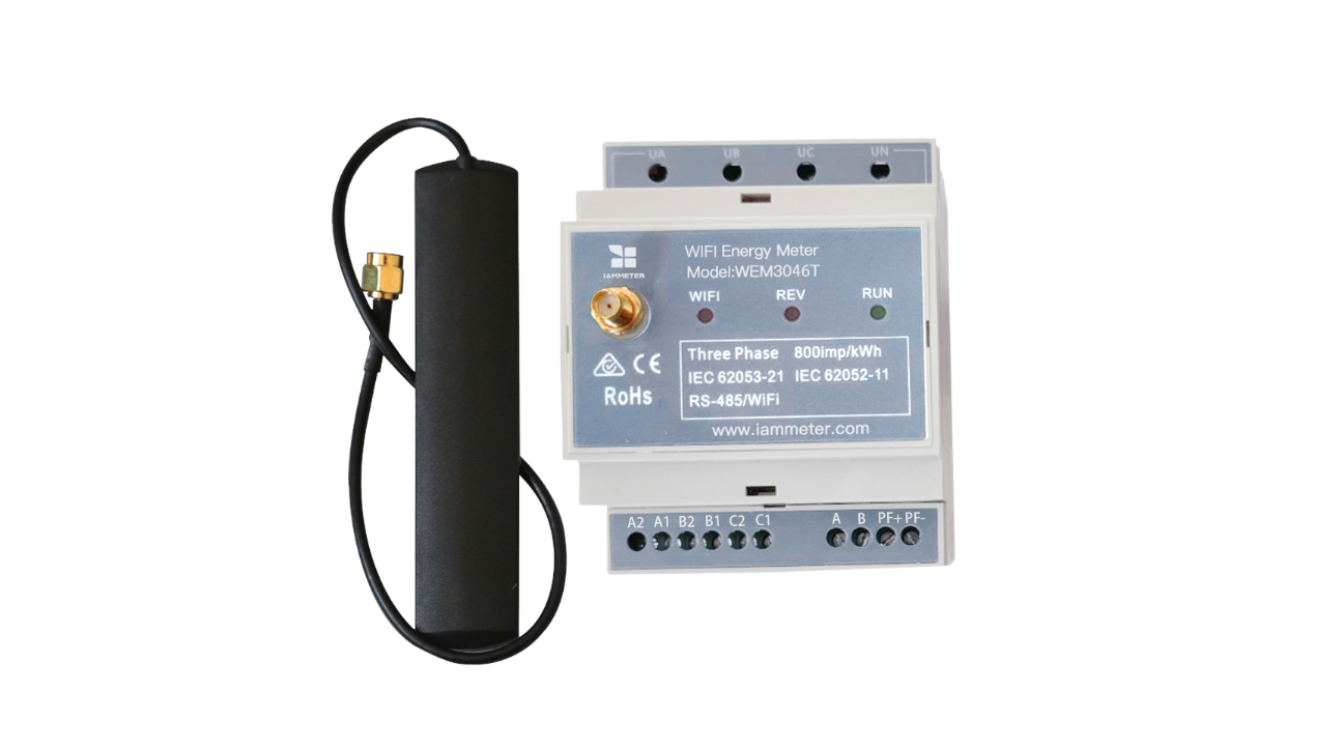
Three Phase Wi-Fi Energy Meter (WEM3046T)
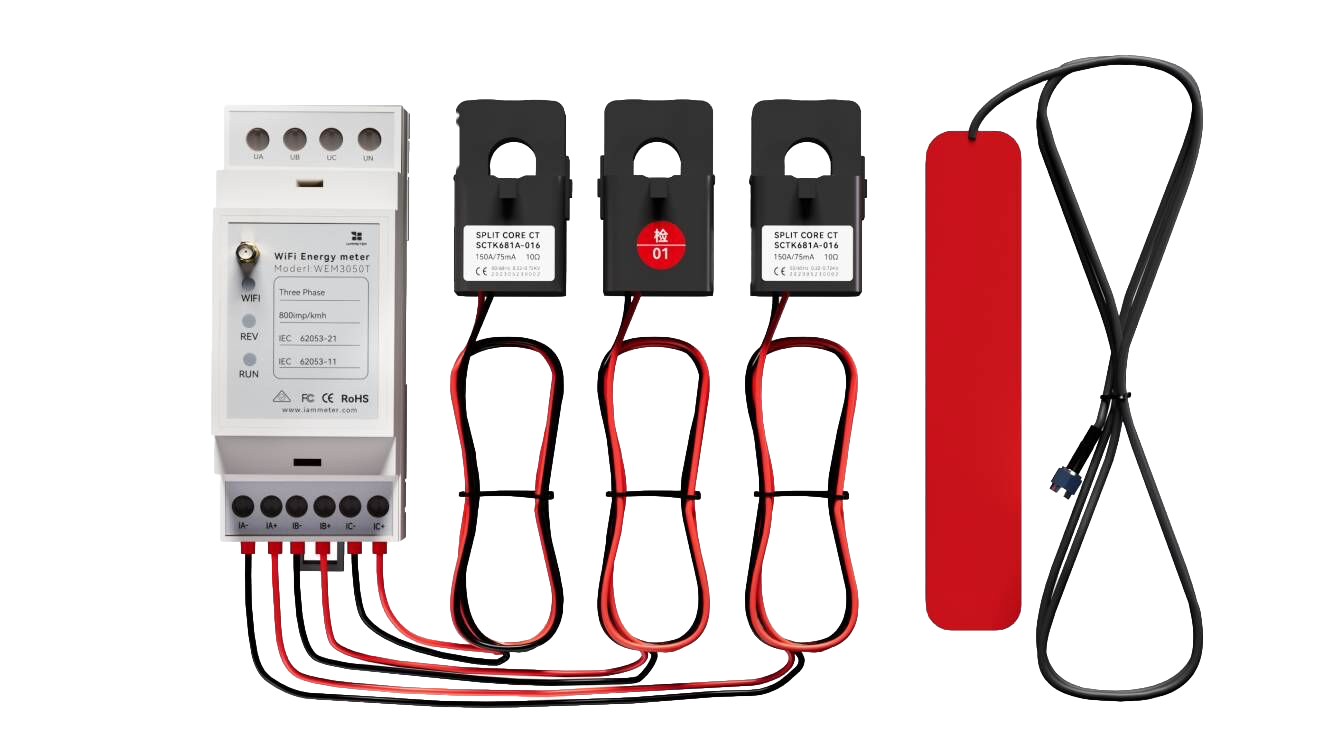
Three Phase Wi-Fi Energy Meter (WEM3050T)