


How to Analyze Home Electricity Consumption and Find Energy Waste
How to Analyze Home Electricity Consumption and Find Energy Waste
An electricity monitor can collect thousands of readings, but more data does not automatically produce a lower bill. The useful question is: what pattern in the data can lead to a specific action?
A practical home energy consumption analysis should help you:
- Establish a normal consumption baseline
- Identify electricity that is used continuously
- Find short periods of unusually high demand
- Understand when electricity costs the most
- Compare similar periods before and after a change
- Separate real savings from weather, occupancy and normal variation
This guide explains the analysis method. For the IAMMETER report controls and operating steps, use the Energy Consumption Analysis documentation.
1. Begin with a Reliable Baseline
A baseline describes normal electricity use before an energy-saving change is made.
Start with at least seven days that include weekdays and a weekend. A 28-day period is usually more representative when weather and household schedules vary.
Record:
- Total kWh
- Estimated electricity cost
- Maximum power
- Typical overnight base load
- High-consumption hours
- Differences between weekdays and weekends
- Weather, occupancy or unusual events that affected consumption
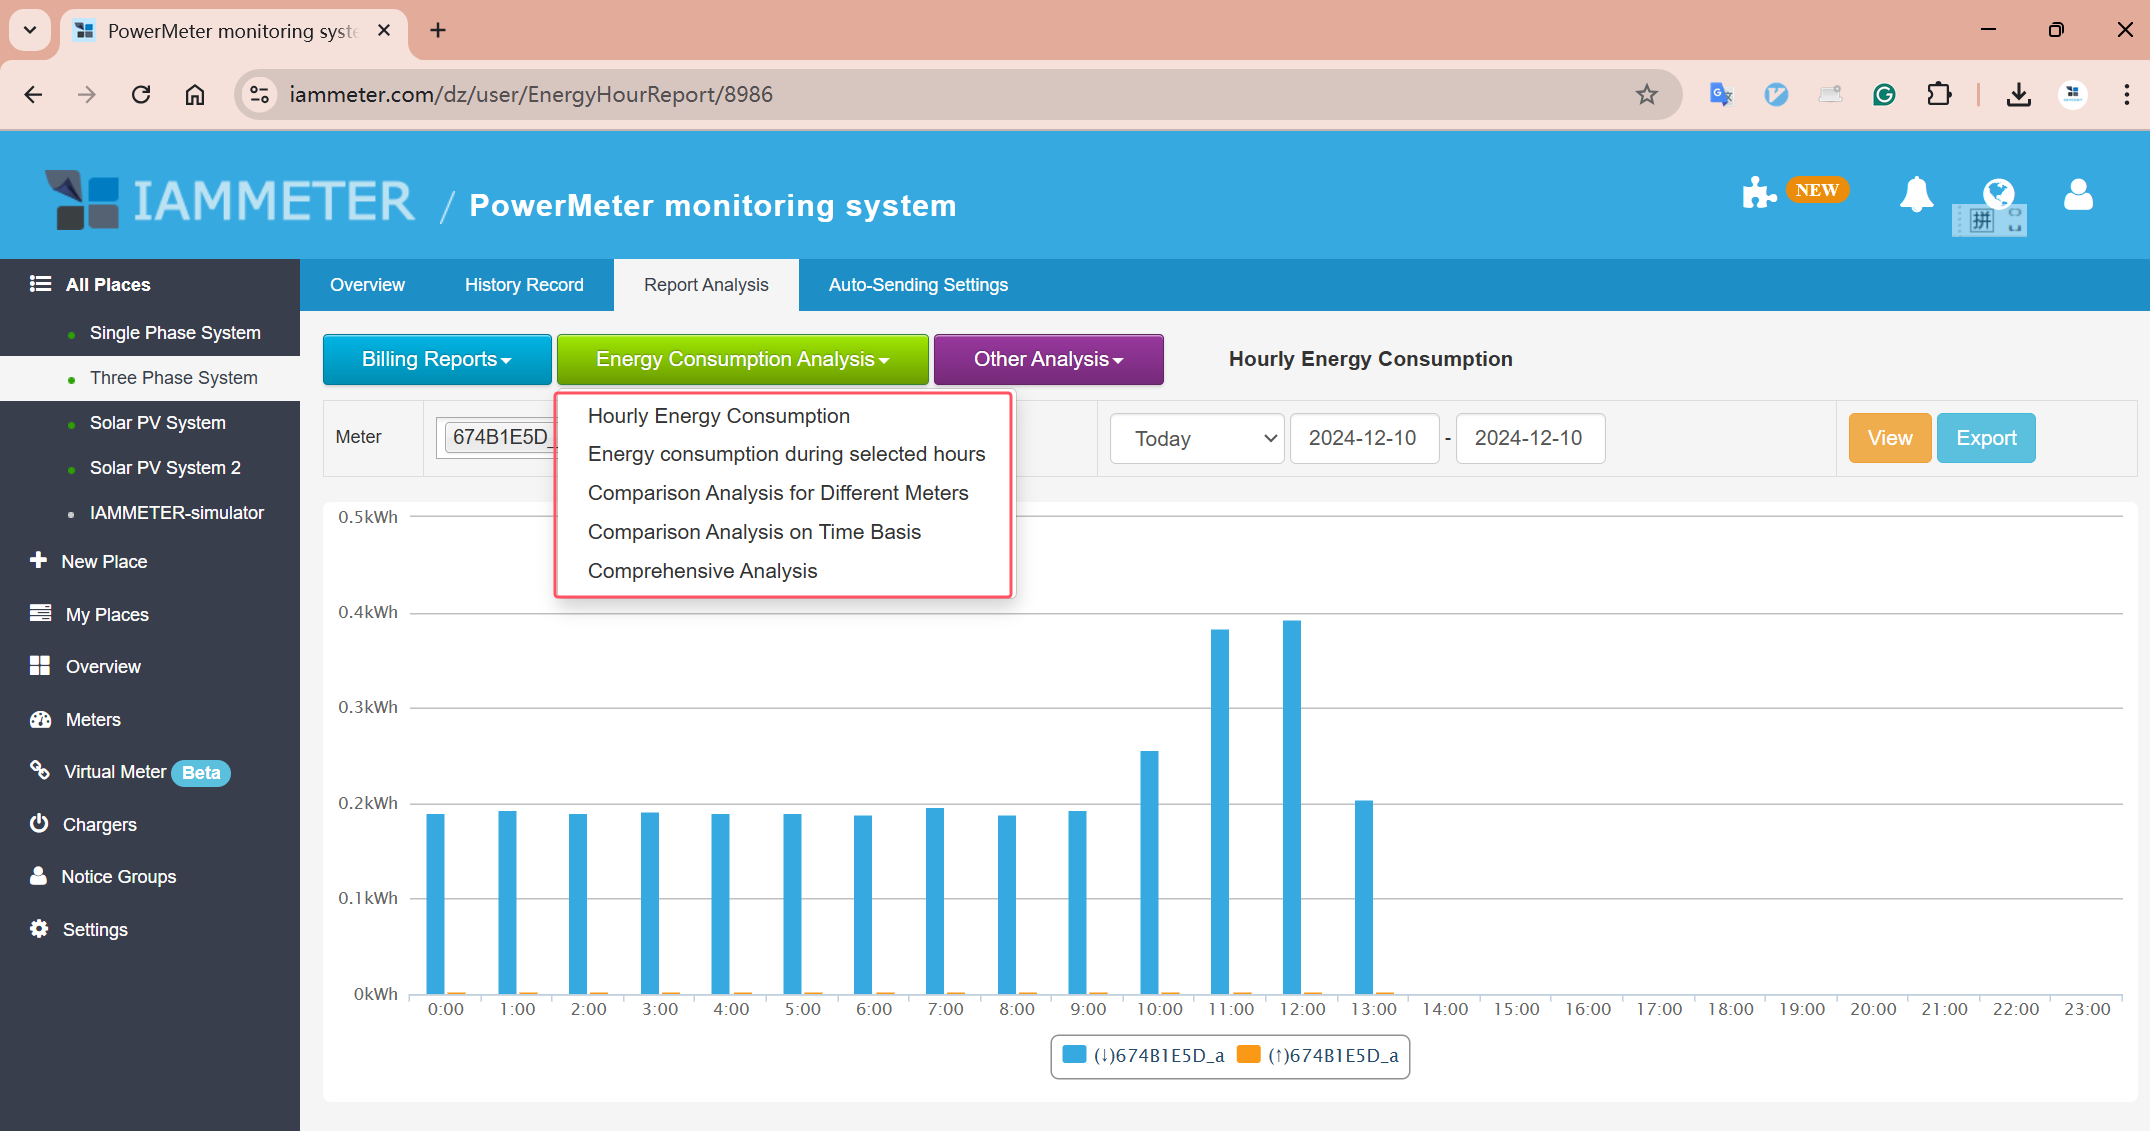
Why One Day Is Often Misleading
One day may contain visitors, unusually hot or cold weather, EV charging or a different heating schedule. Comparing that day with an ordinary day can make a change appear more effective—or less effective—than it really was.
Use multiple comparable days and note external factors before drawing a conclusion.
2. Find the Overnight Base Load
Base load is the electricity used when most obvious loads are off. It may include refrigerators, routers, standby electronics, pumps, ventilation, security systems and equipment that runs continuously.
To analyze it:
- Select several quiet overnight periods.
- Find the lowest stable power level.
- Check whether that level is consistent across nights.
- Investigate unexpected steps or cycles.
- Switch suspected loads off safely, one at a time, and observe the change.
Estimate the Daily Energy Behind a Constant Load
For a load that remains approximately constant:
Daily energy (kWh) = power (W) × 24 ÷ 1000
For example, a continuous 200 W base load uses approximately:
200 × 24 ÷ 1000 = 4.8 kWh/day
Over 30 days, that is about 144 kWh. This calculation is an estimate; cycling loads should be assessed from recorded energy rather than one instant power value.
3. Identify Peak Demand and Expensive Load Events
Peak power shows when several large loads operate together or when one high-power device starts.
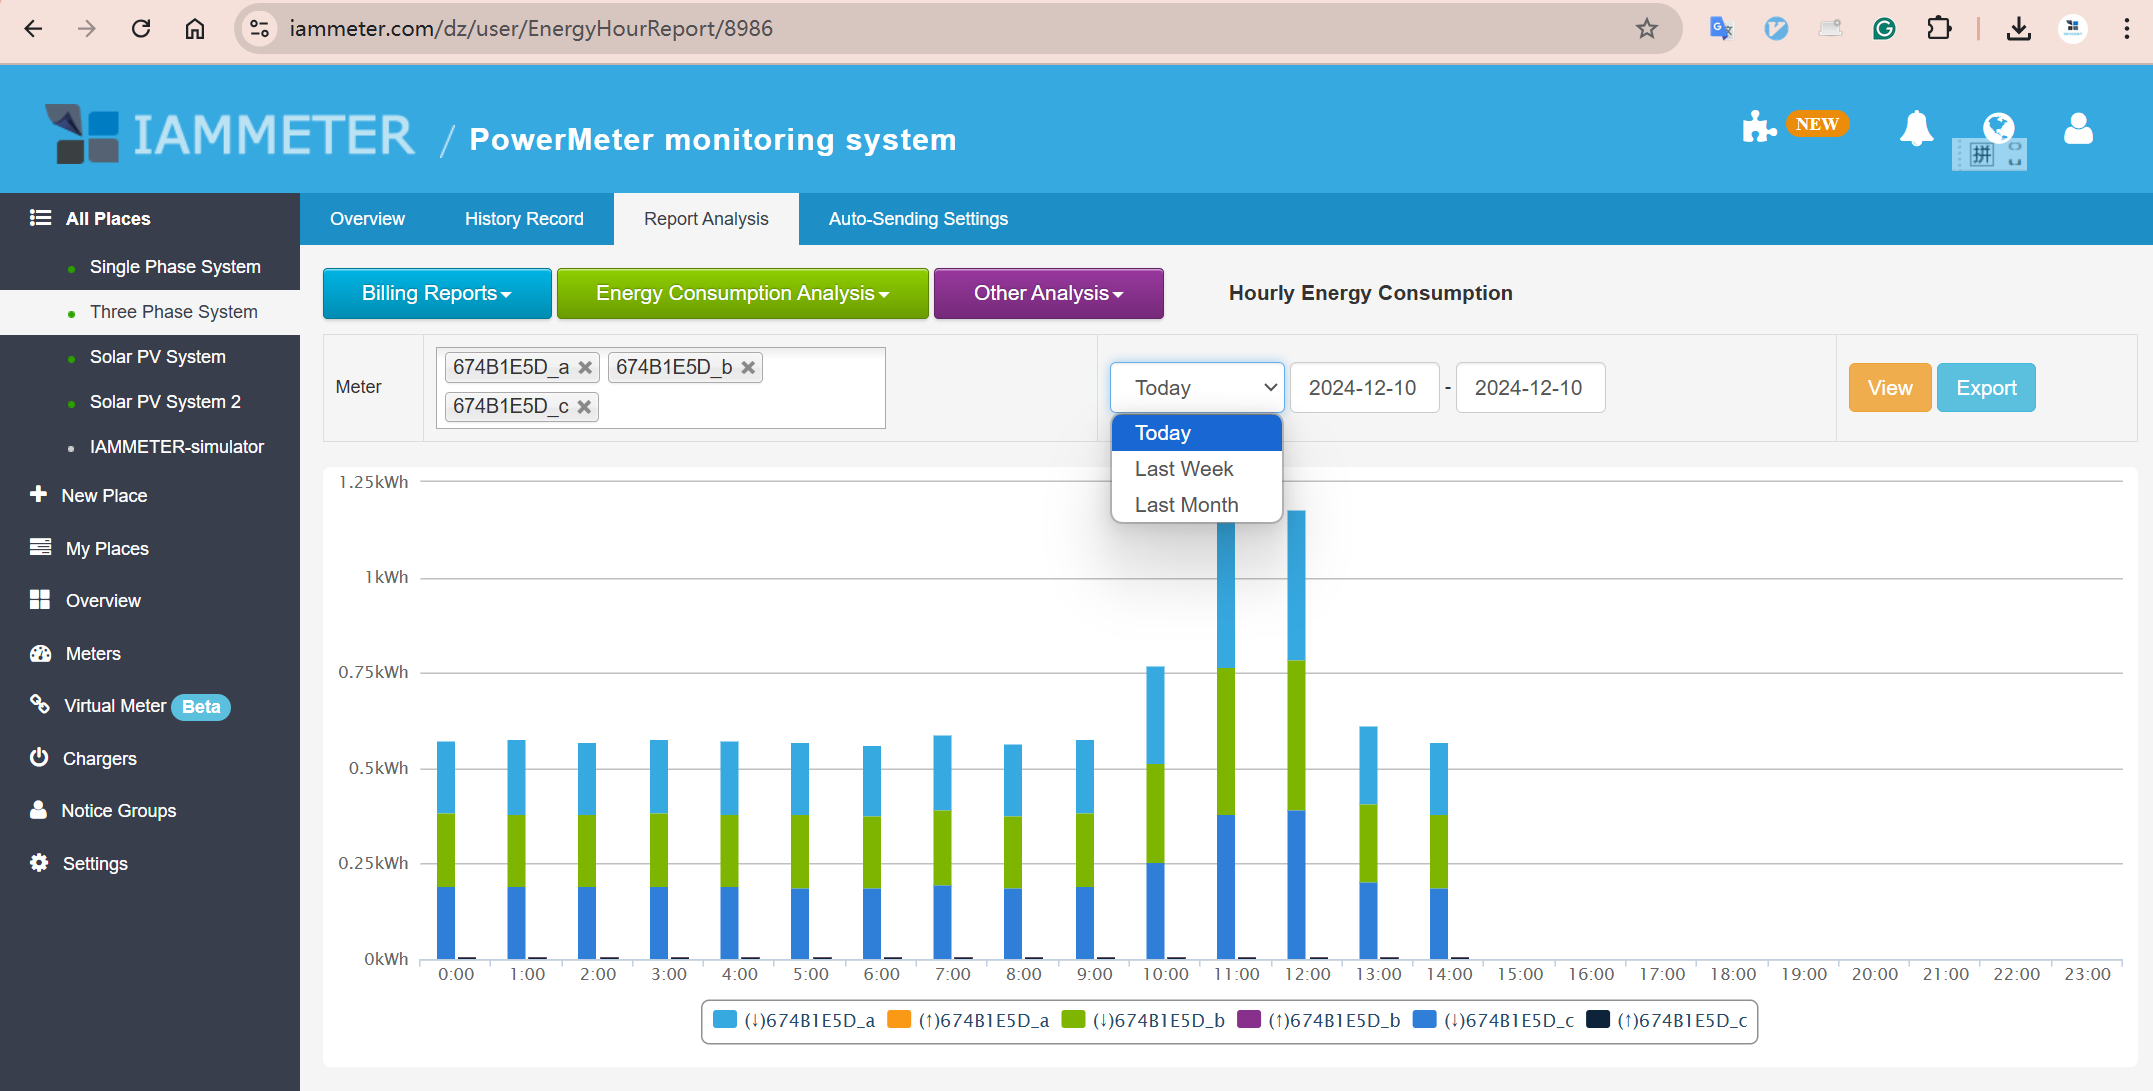
When reviewing a peak, ask:
- What time did it begin?
- How long did it continue?
- Does it repeat on similar days?
- Which known loads were operating?
- Could two flexible loads run at different times?
- Does the electricity tariff include a demand or peak-period charge?
Common residential contributors include:
- Electric water heating
- Space heating and heat pumps
- Air conditioning
- EV charging
- Electric cooking
- Pool or circulation pumps
A whole-home meter shows the combined result. To confirm the consumption of one hardwired load, use a dedicated circuit measurement; for one plug-in appliance, an energy-monitoring smart plug may be more appropriate.
4. Analyze Consumption During Specific Hours
Total daily kWh can hide when energy was used. Selected-hour analysis is especially useful with time-of-use tariffs.
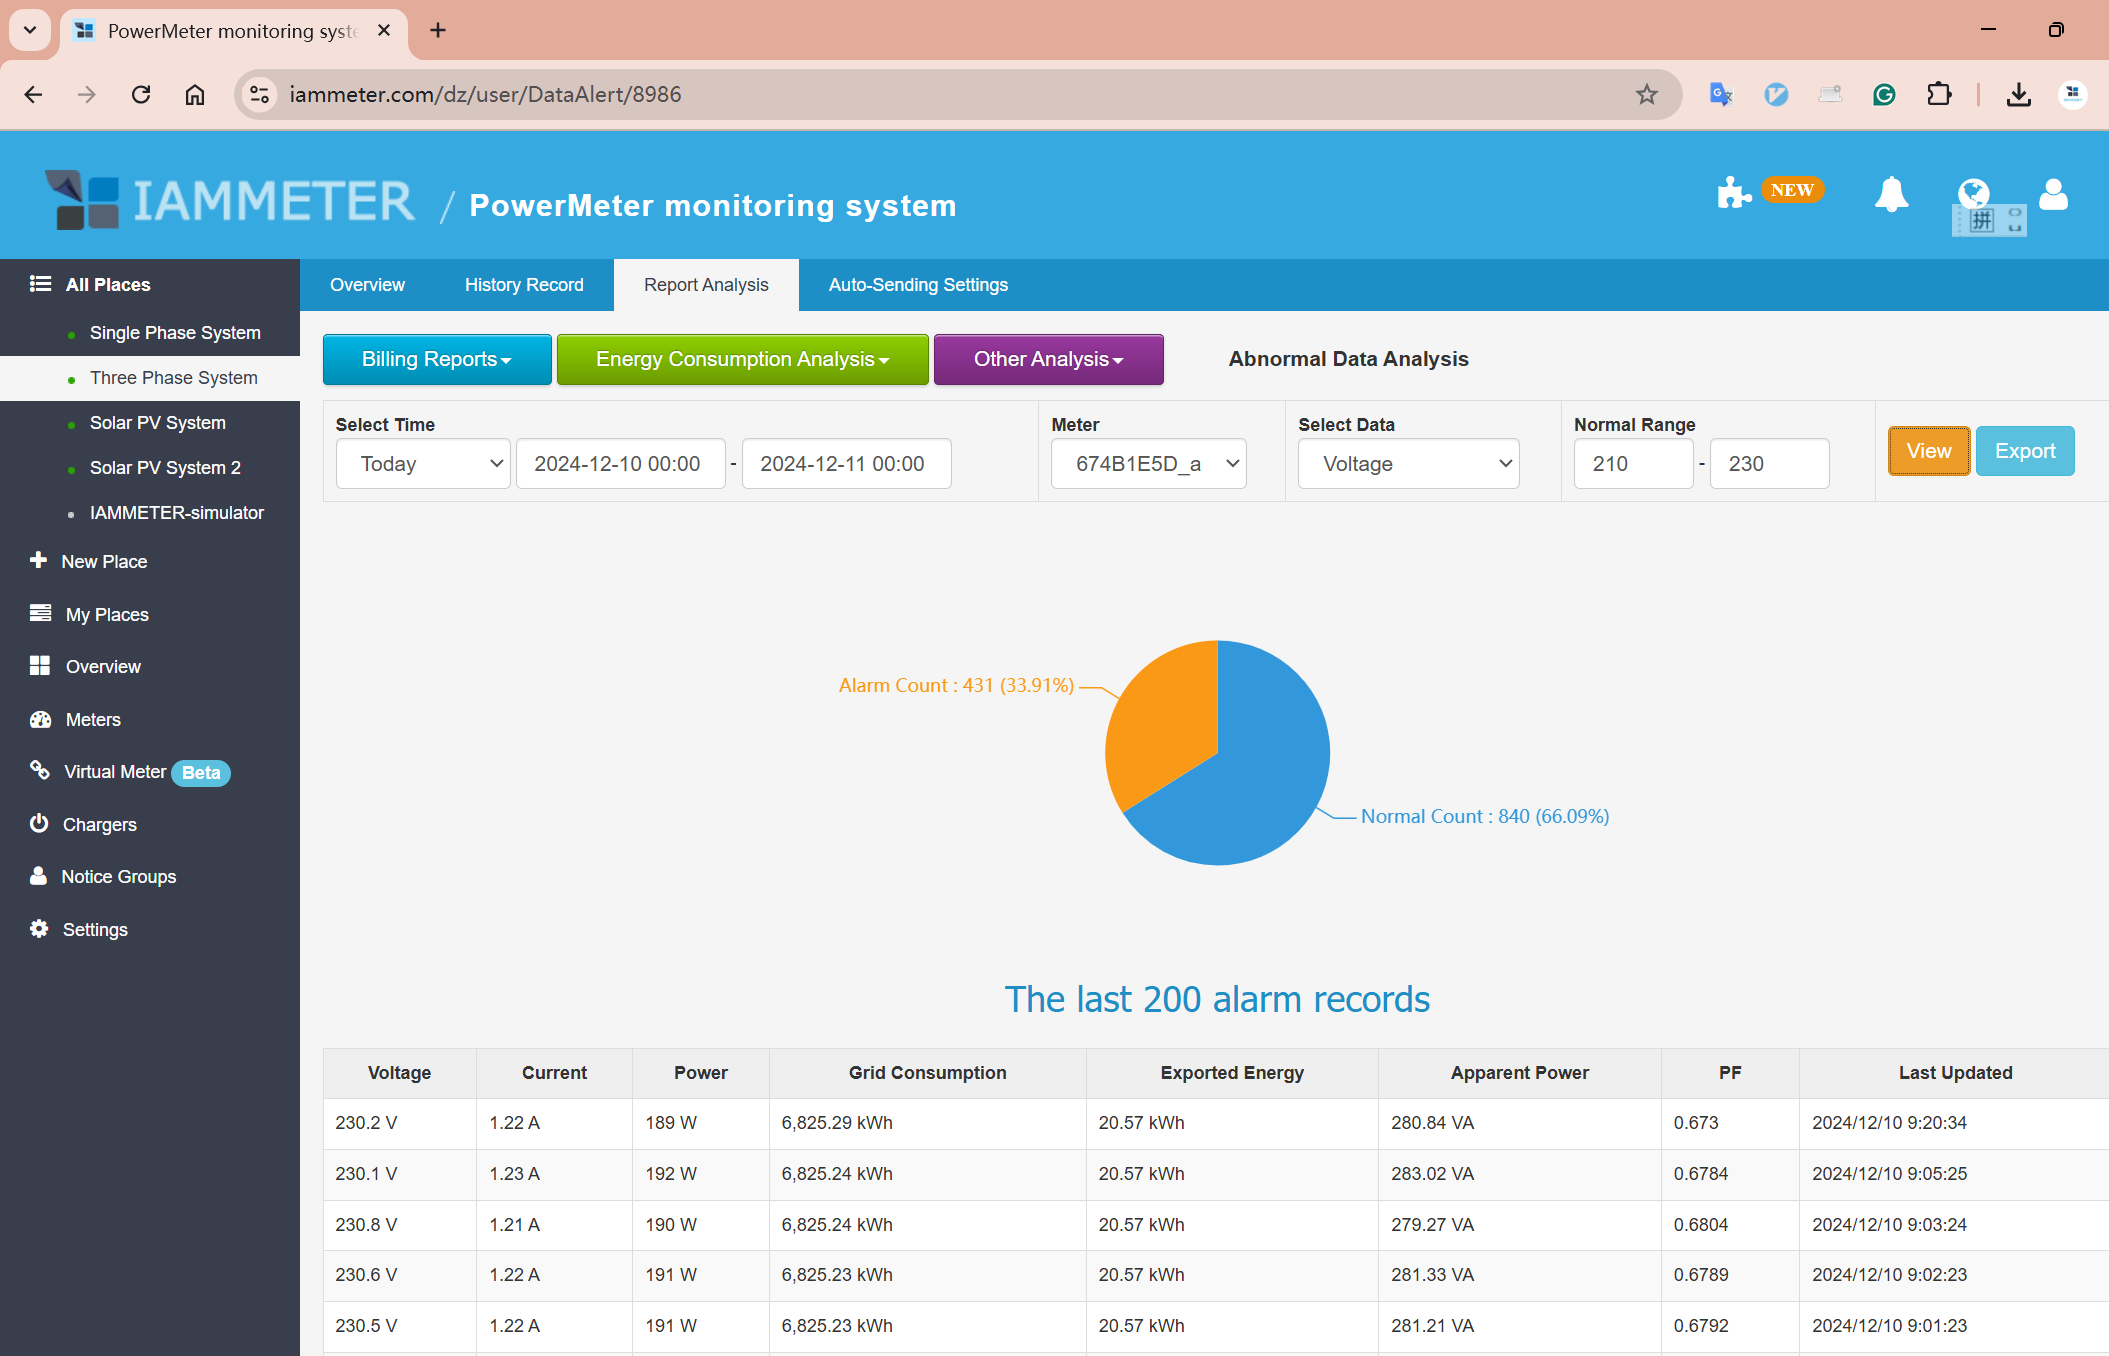
Divide the day into meaningful periods, such as:
- Overnight
- Morning activity
- Daytime absence or work-from-home hours
- Evening peak
- Off-peak tariff window
Then compare both kWh and cost. Moving 3 kWh from an expensive period to a cheaper period may reduce the bill even when total daily energy remains unchanged.
Questions to Ask
- Does water heating occur during the highest tariff?
- Does EV charging begin before the off-peak period?
- Does cooling continue after the home is unoccupied?
- Is the overnight load higher on particular days?
- Are flexible loads operating at the same time?
5. Compare Weekdays, Weekends and Similar Periods
Time-based comparison makes patterns easier to see.
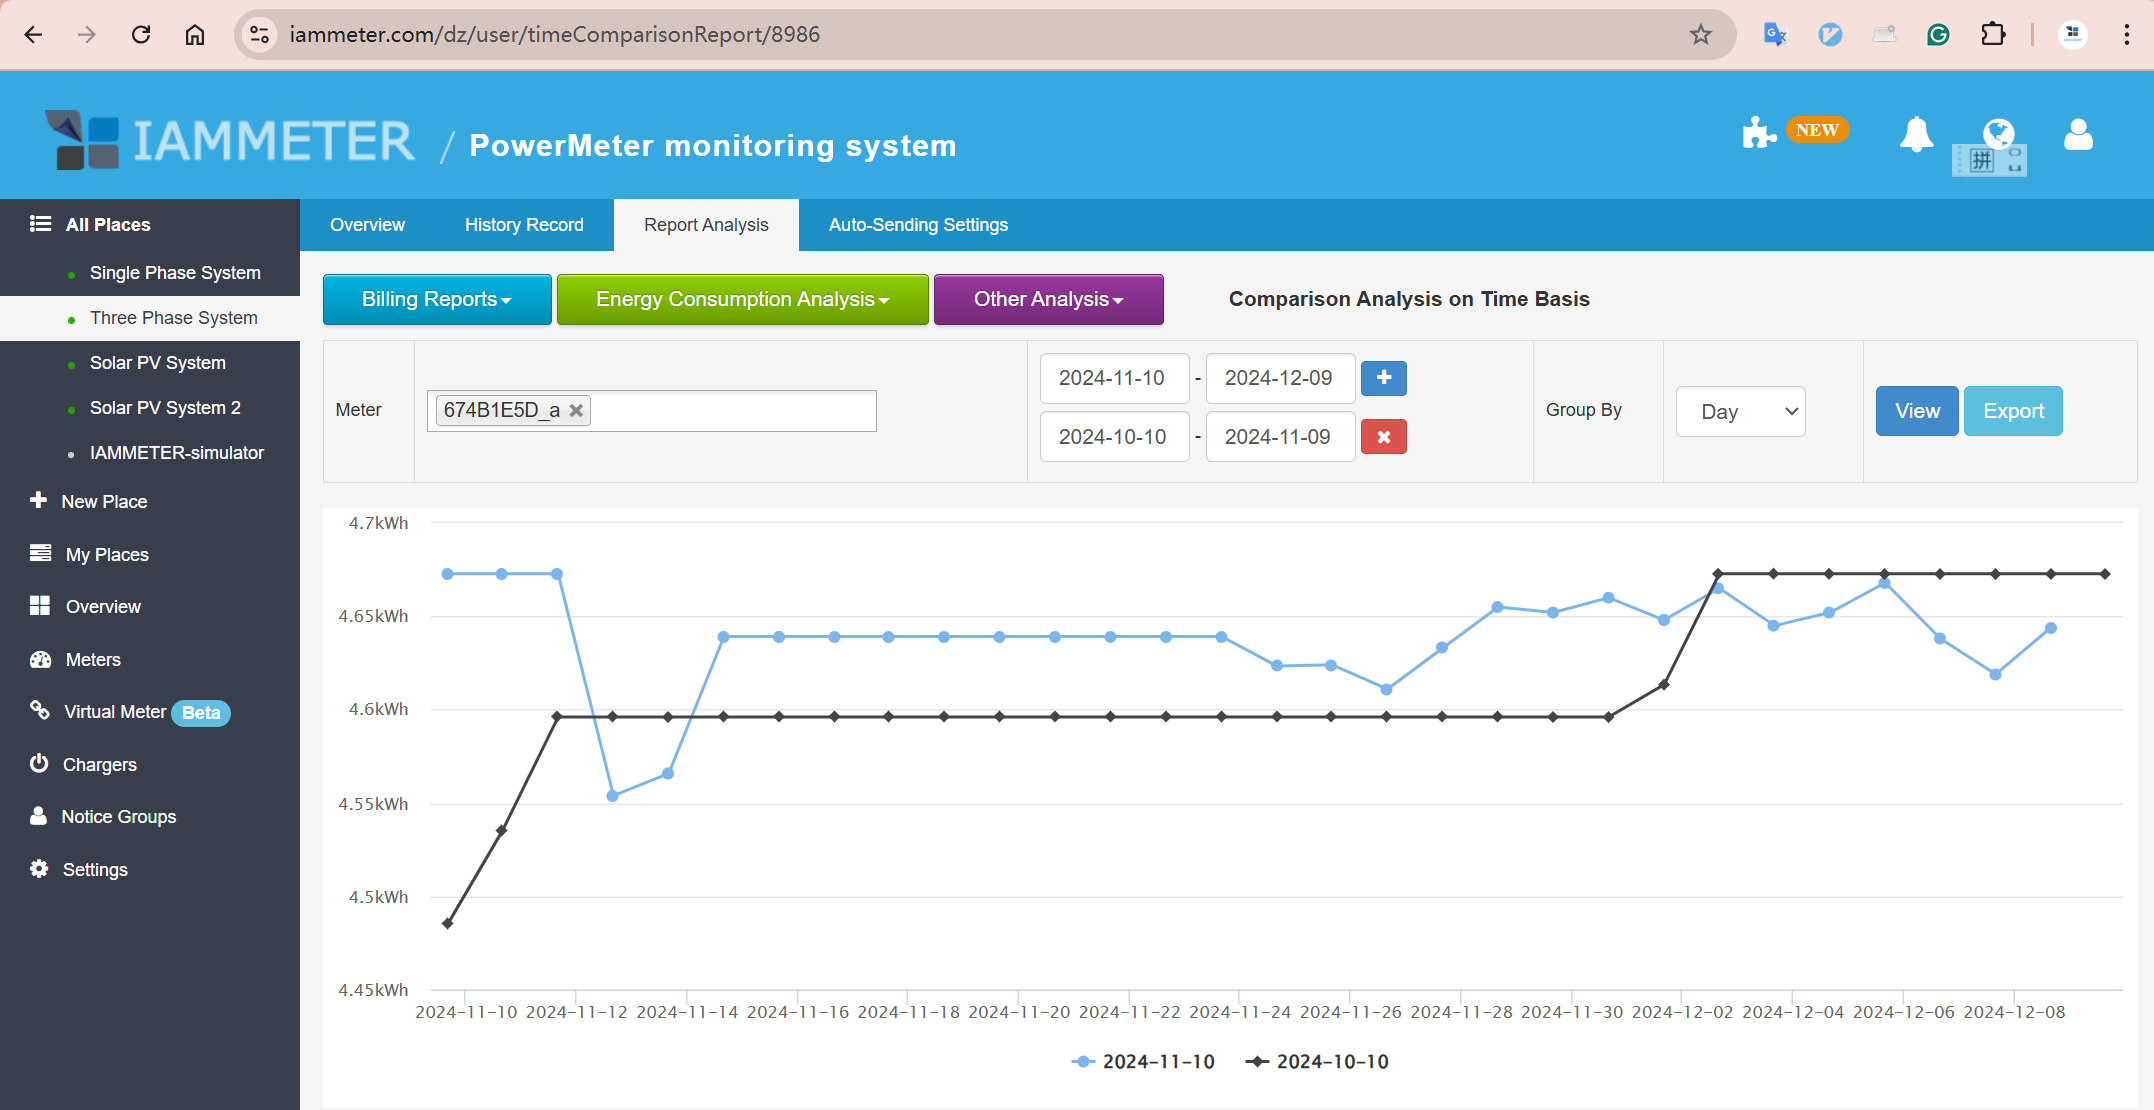
Useful comparisons include:
- This Monday vs previous Mondays
- Weekdays vs weekends
- This billing period vs the previous billing period
- Similar-temperature days before and after a heating change
- The same tariff hours before and after a schedule change
Avoid comparing periods with different lengths or very different conditions without adjustment.
6. Verify an Energy-saving Change
Use a controlled before-and-after process:
- Choose one problem shown in the baseline.
- Make one change.
- Keep other settings as consistent as practical.
- Collect data for a comparable period.
- Compare kWh, peak power and electricity cost.
- Check whether weather or occupancy explains part of the difference.
- Repeat the comparison before treating the result as permanent savings.
Example: Change a Water-heating Schedule
Suppose analysis shows that a water heater runs during an expensive evening tariff.
- Baseline: Record its operating period and the whole-home cost during comparable evenings.
- Change: Move the heating cycle to an off-peak period, without reducing required hot-water service.
- Verify: Compare the same number of days and tariff periods.
- Interpret: Total kWh may remain similar, but electricity cost can fall because the timing changed.
If the home later adds solar, the same water-heating load may also be scheduled during periods of recurring solar surplus. First monitor inverter generation together with grid import/export to confirm when surplus energy is actually being exported. Then compare water-heating energy, grid export and later grid import before deciding whether the schedule change is worthwhile.
See the Home Solar Monitoring Solution for a practical way to measure solar generation, home consumption and grid exchange. Monitoring identifies when surplus is available; automatic surplus control requires a separate compatible control setup.
Example: Reduce Overnight Base Load
Suppose the home remains near 500 W overnight.
- Switch suspected nonessential loads off one at a time.
- Confirm each change in real-time power.
- Leave the confirmed change in place for several nights.
- Compare average overnight kWh with the baseline.
Do not estimate savings from the nameplate rating alone. Verify them from recorded energy over time.
7. Avoid Common Analysis Mistakes
| Mistake | Why it causes a bad conclusion | Better method |
|---|---|---|
| Comparing one unusual day | Weather or occupancy may dominate the result | Compare several similar days |
| Comparing different period lengths | Total kWh is not directly comparable | Use equal periods or normalize per day |
| Looking only at kWh | Time-of-use cost may change without a kWh change | Compare both energy and cost |
| Looking only at instant power | Cycling loads vary over time | Use accumulated kWh for the period |
| Changing several things together | The effect of each action is unknown | Change one variable at a time |
| Assuming every peak identifies an appliance | Whole-home data shows a combined result | Confirm with a known-load test or sub-meter |
| Ignoring measurement boundaries | Two meters may not measure the same loads | Confirm CT positions before comparing |
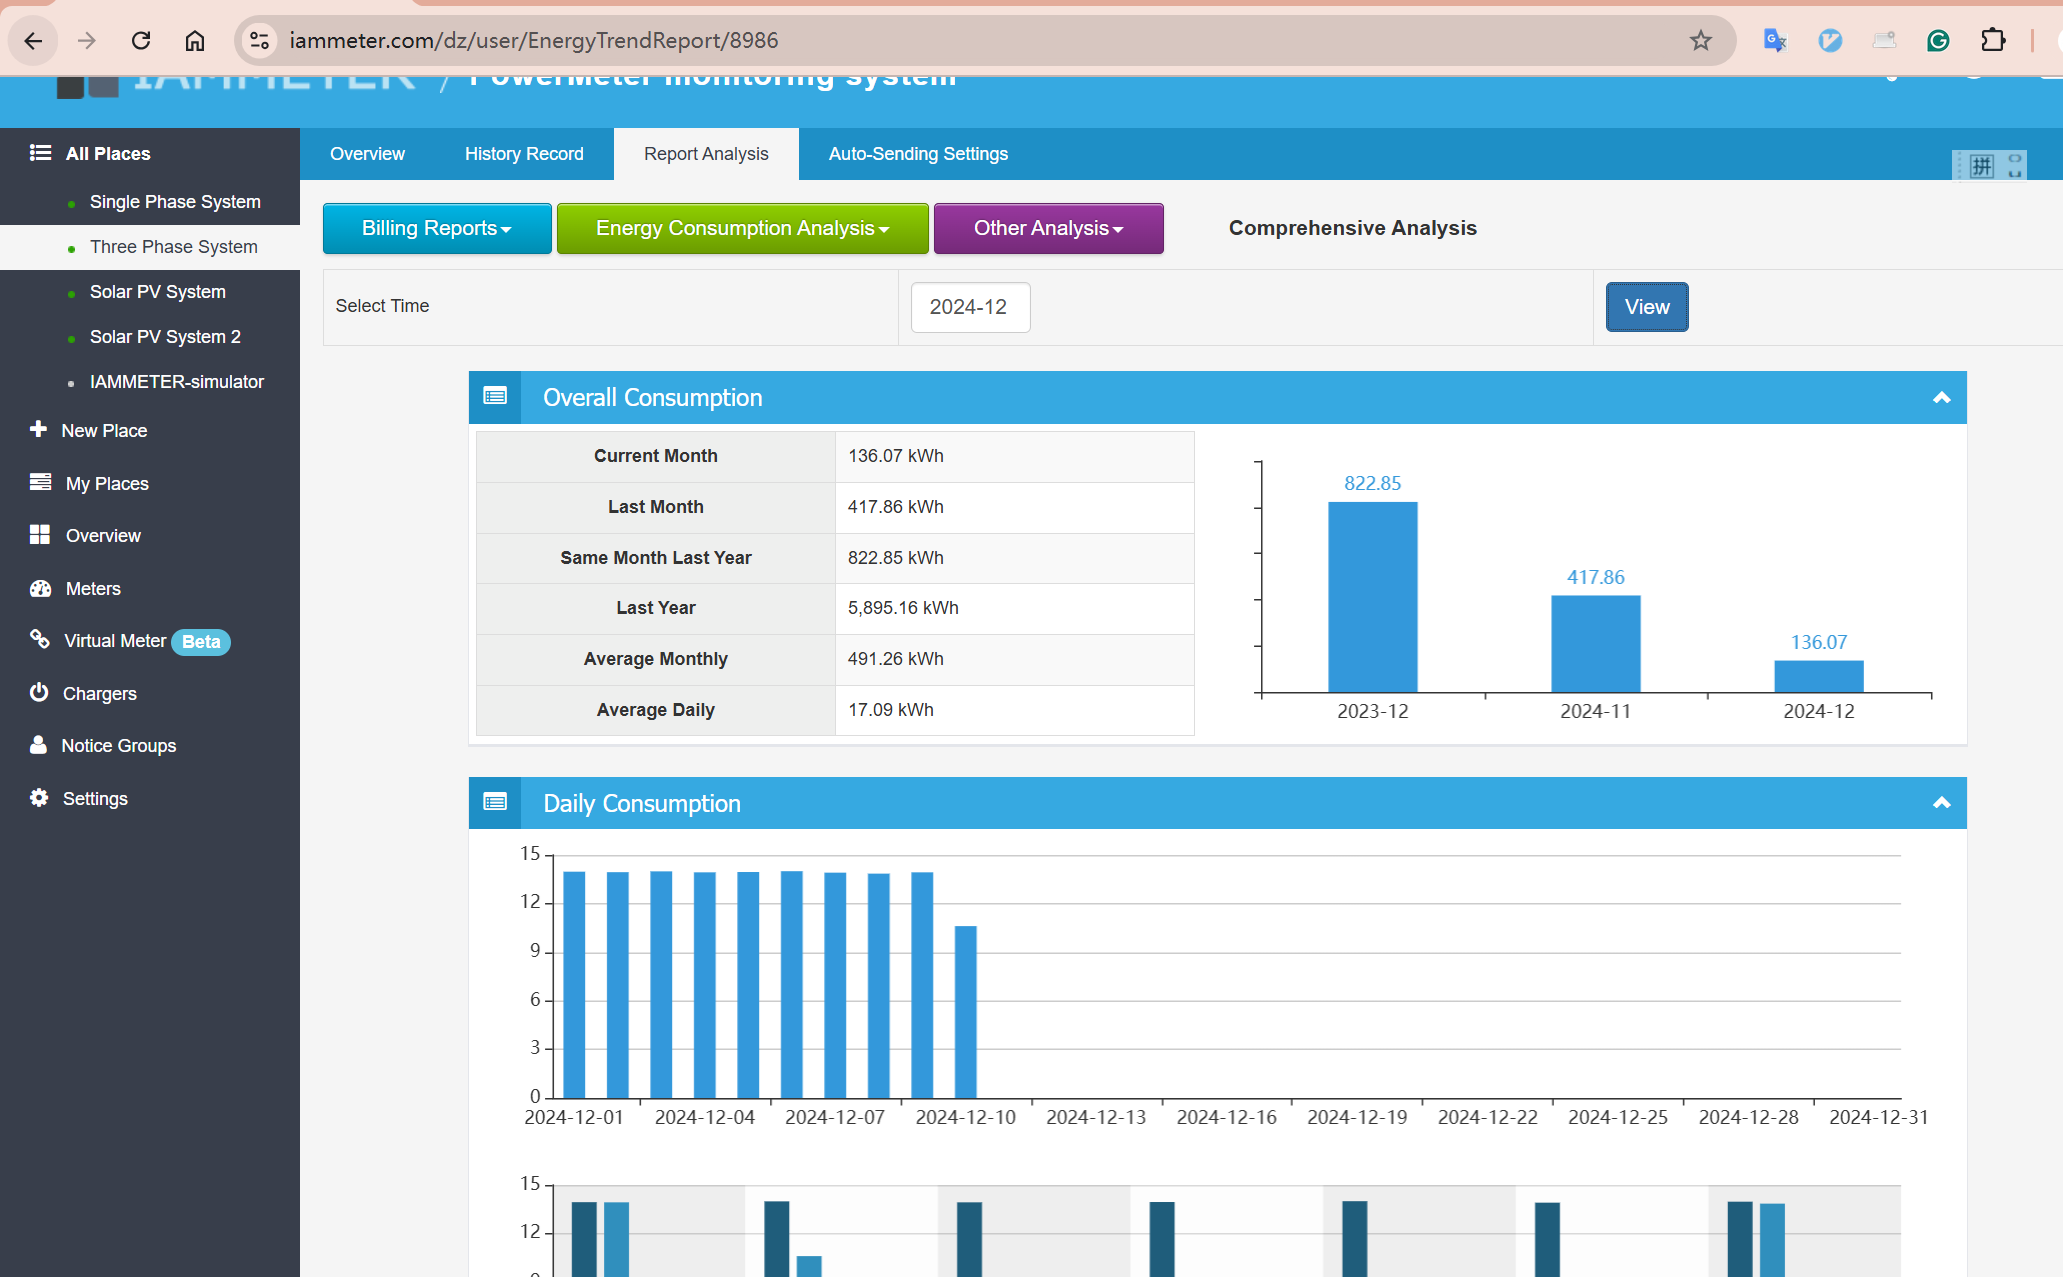
8. Use IAMMETER Reports for the Analysis
IAMMETER can support the workflow with:
- Hourly energy consumption
- Selected-hour analysis
- Day, month and billing-period reports
- Time-based comparison
- Comparison across measurement points or meters
- Tariff-based electricity-cost estimates
Related operating guides:
9. Build a Repeatable Monthly Review
A short monthly review is more useful than collecting data without acting on it.
Review:
- Total kWh and electricity cost
- Highest-demand day and hour
- Typical overnight base load
- Peak-tariff consumption
- Any abnormal event
- The result of the previous action
- One next change to test
Keep a simple record of the baseline, action, comparison period and result. This prevents the same issue from being investigated repeatedly and makes long-term savings easier to verify.
10. Next Steps
- Learn what to monitor: Electricity Usage Monitor for Home
- Compare monitoring methods: How to Monitor Electricity Usage at Home
- Choose a residential system: Home Energy Monitoring Solution
- Plan CT positions and validate readings: Residential Electricity Monitoring Setup
- Open the live home electricity demo: IAMMETER-Cloud Demo
The purpose of energy consumption analysis is not to produce more charts. It is to identify one change, measure the result and decide whether that change is worth keeping.