


Still Using Power After Closing? Track Hourly Energy Use and Set Alerts with IAMMETER
This is a hands-on walkthrough: find electricity use after closing, investigate the cause and set up a useful alert.
Our example workshop or office opens at 09:00, finishes work at 18:00 and completes cleaning and shutdown at 19:00. This is a hypothetical schedule; use your own operating hours.
The screenshots come from IAMMETER documentation and show where to find each feature. Their sites, dates and values are not measurements from this example business. Older interfaces may look slightly different from your account. Click an image to open it at full size.
In this guide
- Check what you are measuring
- Find unusual hours on the consumption chart
- Measure after-hours consumption separately
- Set a power alert with a time window
- Check delivery and compare before and after
1. Check what you are measuring
Sign in to IAMMETER Cloud and select the relevant Place. If you do not have a meter yet, explore the IAMMETER Demo account. It is not your business's data, and you do not need to change its alert settings.
- Main supply: check consumption across the premises.
- Individual circuit: check the connected load, such as air conditioning or auxiliary equipment.
- Three-phase or multiple channels: confirm which phases and channels are included. One phase is not the total for the whole premises.
With solar PV, distinguish grid imports from total site consumption. Keep the measurement scope consistent and check the site's time zone and data coverage. A main meter can reveal unusual consumption; it cannot automatically identify the appliance left on.
Start with one complete, normal working day, then look at a week. Missing readings and hours that have not happened yet do not mean zero consumption.
2. Find unusually high consumption after closing
Report Analysis → Energy Consumption Analysis → Hourly Energy Consumption
Select the meter or channel and date, then click View. The screenshot shows the selectors and hourly chart.
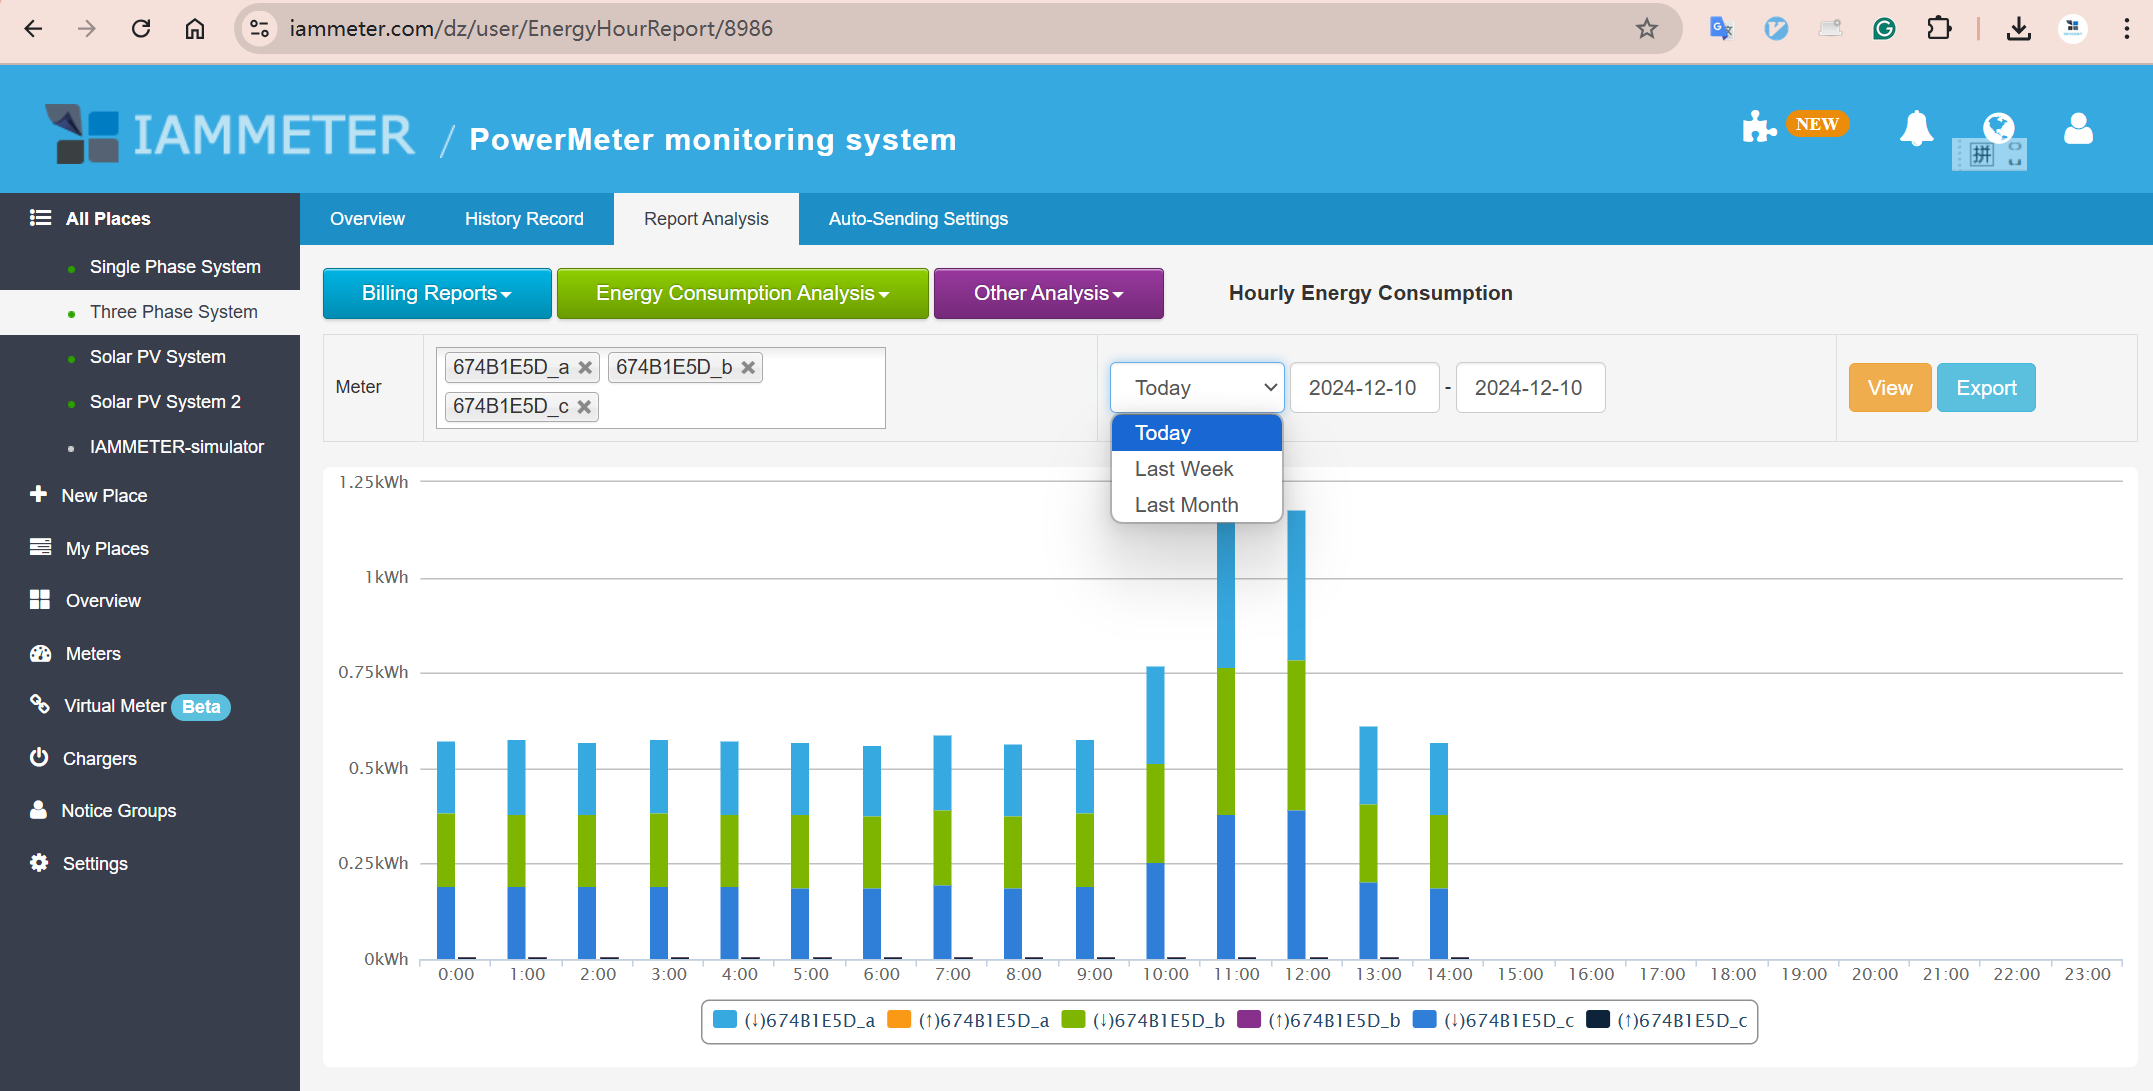
Figure 1. This documentation screenshot shows the current day. Hours later in the day have not yet appeared; their absence does not prove that overnight consumption is zero.
What should you look for?
Start after shutdown is complete—19:00 in this example. Does consumption fall? Do some hours remain unusually high? Compare the same hours on other normal working days.
The chart shows energy per hour (kWh), not instantaneous power (W). It reveals patterns over time; a power alert checks whether the load crosses a threshold. These are different measurements.
For a multi-day selection, check the report's hourly averaging method. A column is not necessarily the week's accumulated energy. Return to a single day to investigate a particular date.
See hourly consumption analysis and report definitions.
3. Measure after-hours consumption separately
Use Energy consumption during selected hours to group the hours you care about instead of searching the full-day chart each time.
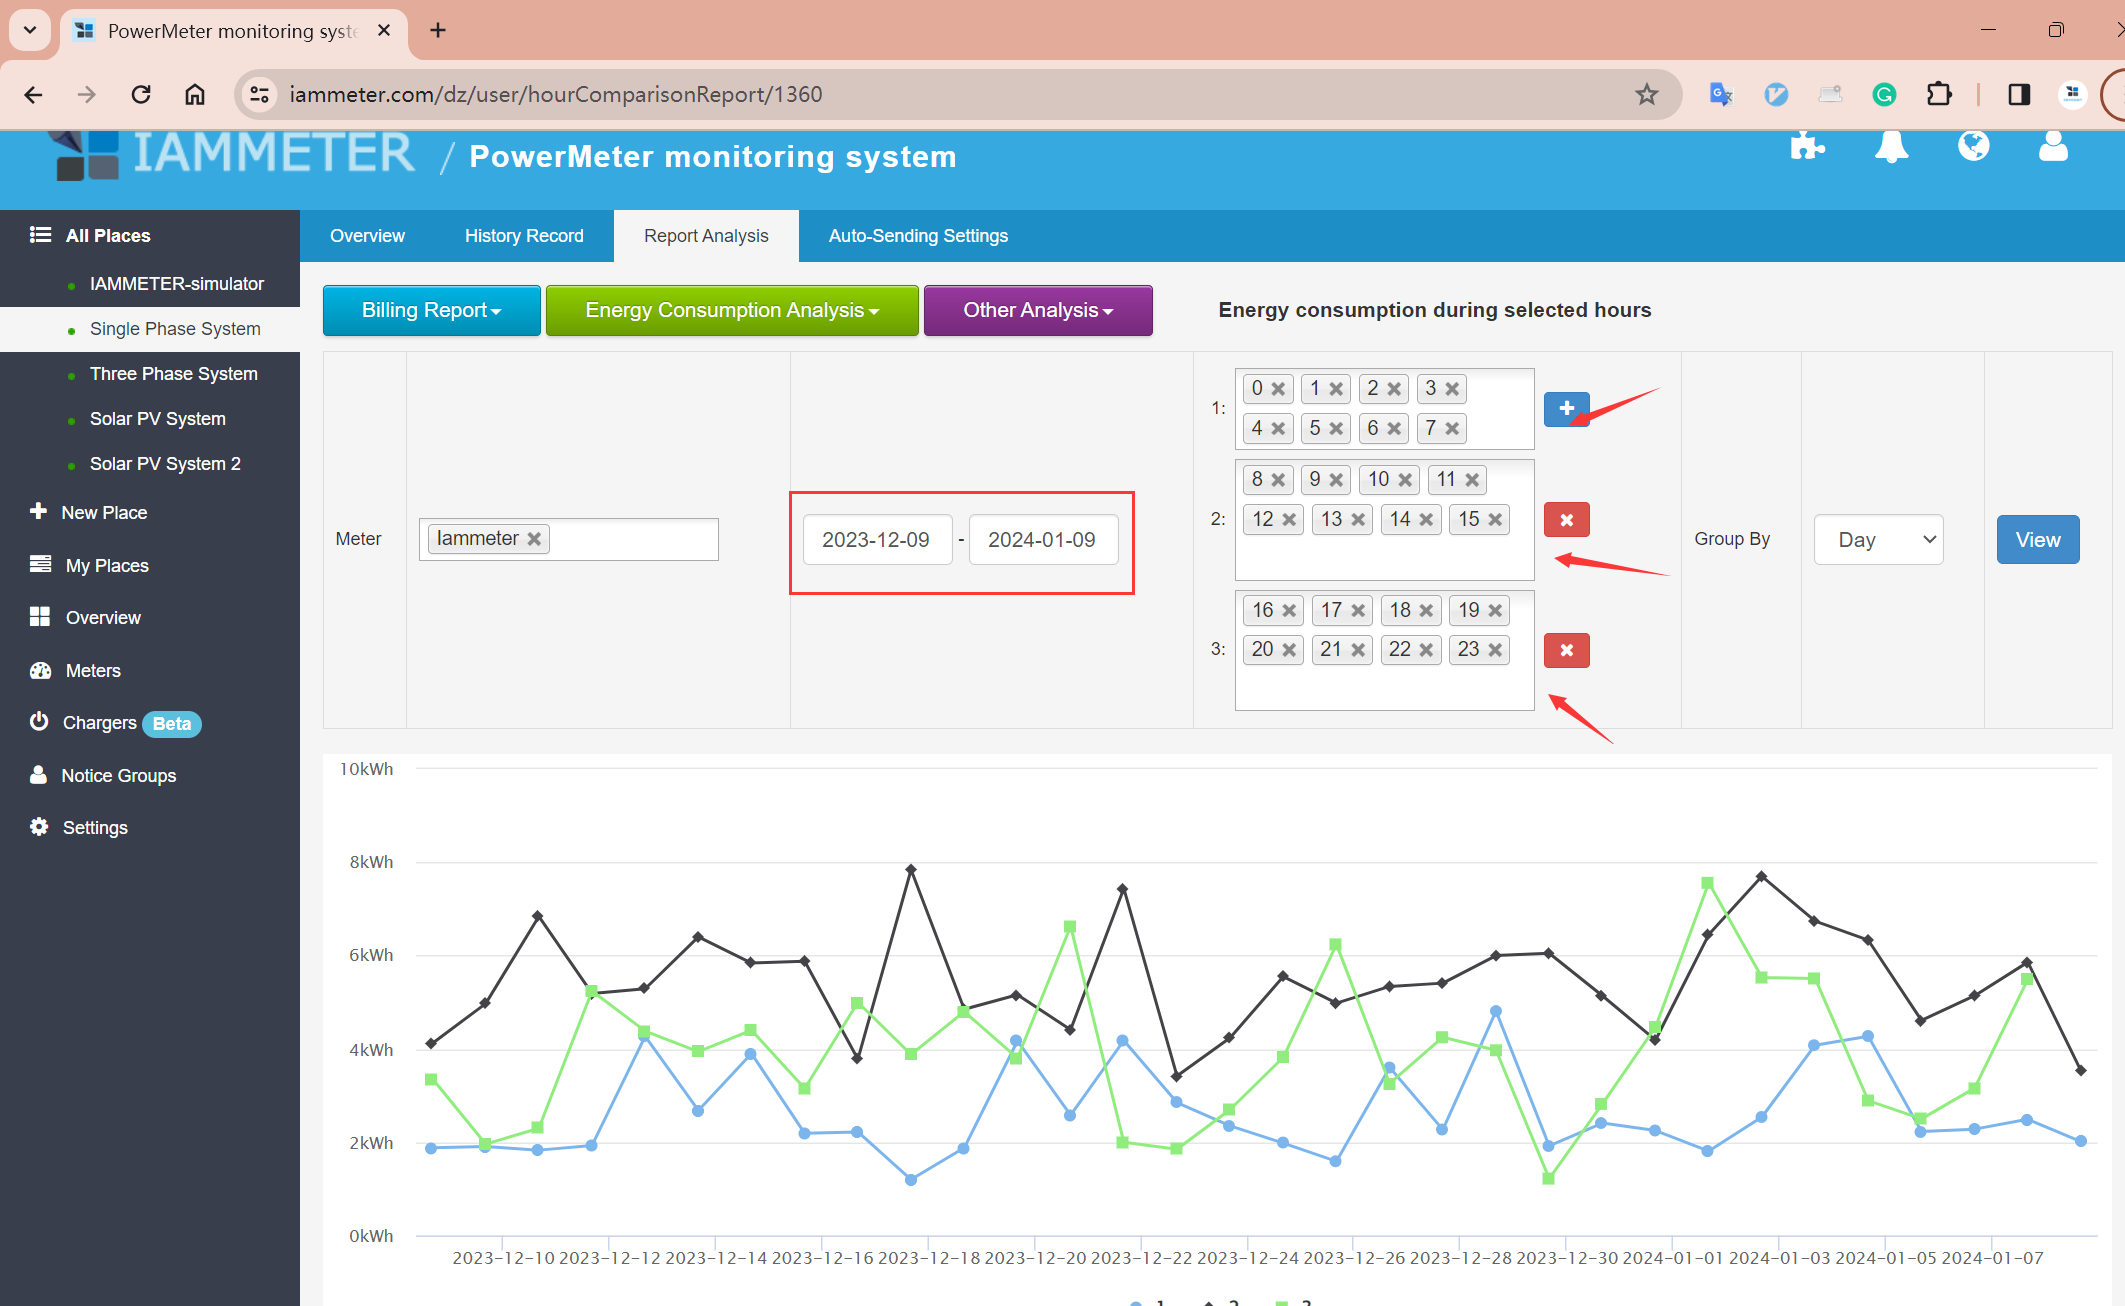
Figure 2. Click “+” to add an hour group, choose Group By, then click View. The illustrated groups 0–7, 8–15 and 16–23 belong to the documentation example, not this business schedule.
For work from 09:00 to 18:00 and shutdown completed by 19:00:
| Period | Hours selected | What to check |
|---|---|---|
| Working hours | 9–17 | Normal operating loads |
| Shutdown and cleaning | 18 | Keep these activities separate |
| Outside working hours | 19–23 and 0–8 | Evening and early-morning consumption |
Hour 18 means 18:00–19:00. With calendar-day grouping, 0–8 and 19–23 are the morning and evening of the same date—not one continuous night from closing to reopening. Check both dates when examining a particular night. Review non-working days separately rather than applying the working-day groups blindly.
Investigate before calling it waste
Check for overtime, equipment running on a delay, or air conditioning and ventilation left on. Refrigeration, security and servers may need to keep running. Night-time consumption is not automatically waste.
Record the date, time window, cause and action. If the source is unclear, consider individual-circuit monitoring. Leave wiring and electrical work to a qualified electrician.
Related guides: selected-hour analysis · individual-load analysis.
Estimate the cost of avoidable consumption
First establish which consumption could actually be avoided, then apply the relevant rate. As a hypothetical example, an extra 6 kWh at CNY 1/kWh costs CNY 6. Do not count all overnight consumption as potential savings.
Apply time-of-use rates to the corresponding periods. Fixed charges and demand charges do not simply fall in proportion to kWh. See tariff setup and daily and monthly billing reports.
4. Set a power alert for your after-hours window
Reports help you look back; alerts help you respond. IAMMETER Cloud's Alarm time setting combines a time window with the power condition.
| Requirement | Rule and limitation |
|---|---|
| Alert when power exceeds a threshold | Use the Cloud power rule. The threshold alone does not distinguish open from closed hours. |
| Alert only during a specified after-hours window | Set Alarm time, then choose the threshold and trigger mode. |
4.1 Create a notification group
Add recipients under Notification → Contacts, then create a Notice Group for the person responsible or on duty. See the notification-group guide.
4.2 Choose power and the correct channel
Open the site's Auto-Sending Settings and add a rule. Select Meter Power (W) and the relevant meter or phase channel.
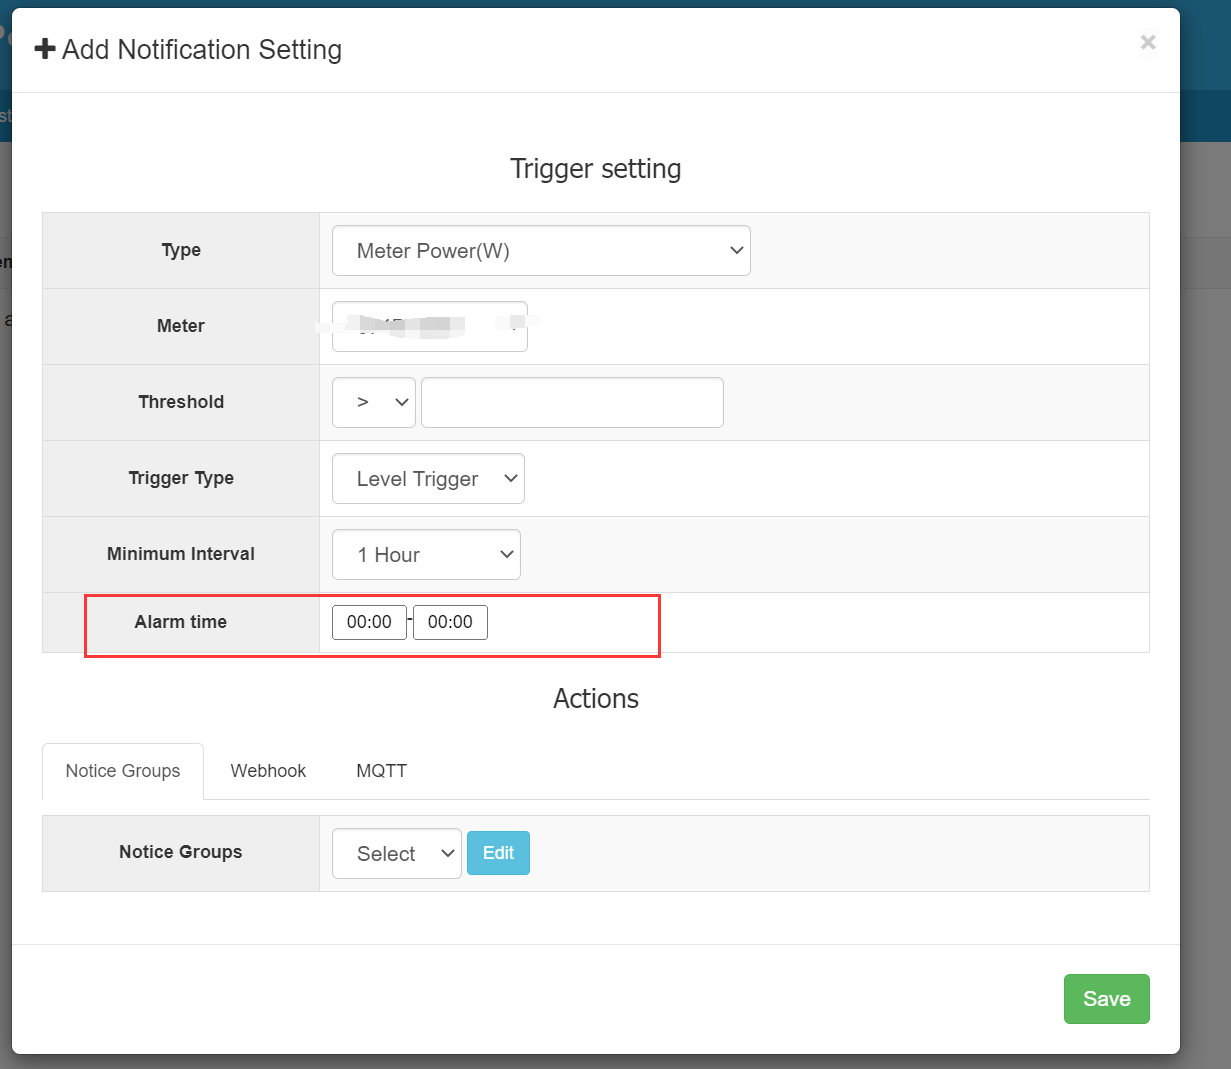
Figure 3. Threshold, trigger mode, repeat interval and Alarm time are configured in the same rule. This screenshot shows the controls, not the example time window below. Select the meter or channel you actually monitor.
4.3 Set the threshold, trigger and repeat interval
Set the comparison and power value under Threshold. Check the units: 1 kW is 1000 W.
- Level Trigger: while the condition remains true, another alert can trigger after the minimum interval.
- Edge Trigger: triggers when the measured state crosses the configured boundary.
- Minimum Interval: limits repeat notifications; it is not a requirement for power to stay above the threshold for that long.
4.4 Set Alarm time for the hours after closing
Suppose normal power after closing is 300–500 W, but normal daytime operation exceeds 1000 W. A threshold above 1000 W on its own could trigger during the day. Add the time window too.
Example: focus first on 19:00–23:00, after shutdown is complete.
- Meter: the same measurement channel used in the investigation.
- Threshold: greater than 1000 W.
- Alarm time: 19:00–23:00.
- Notice Groups: the people responsible for checking equipment.
The rule limits monitoring to this window, then uses the power condition and selected trigger mode. When an alert arrives, check whether there is overtime, delayed equipment operation or something genuinely left on.
Alarm time sets when the alert condition is monitored; Minimum Interval controls repeat notifications. This example covers only 19:00–23:00 on the day, not the entire night or different non-working-day schedules.
Save after setting the window and notification group. See the power-alert and time-window guide for the complete procedure.
These power values illustrate the rule, not a universally suitable threshold. Software notifications do not automatically switch equipment off or replace electrical protection.
5. Check delivery and compare before and after
Run a safe, controlled notification test after saving. Open Auto Sending → Logs, check the trigger records and confirm that the responsible person actually received the alert.
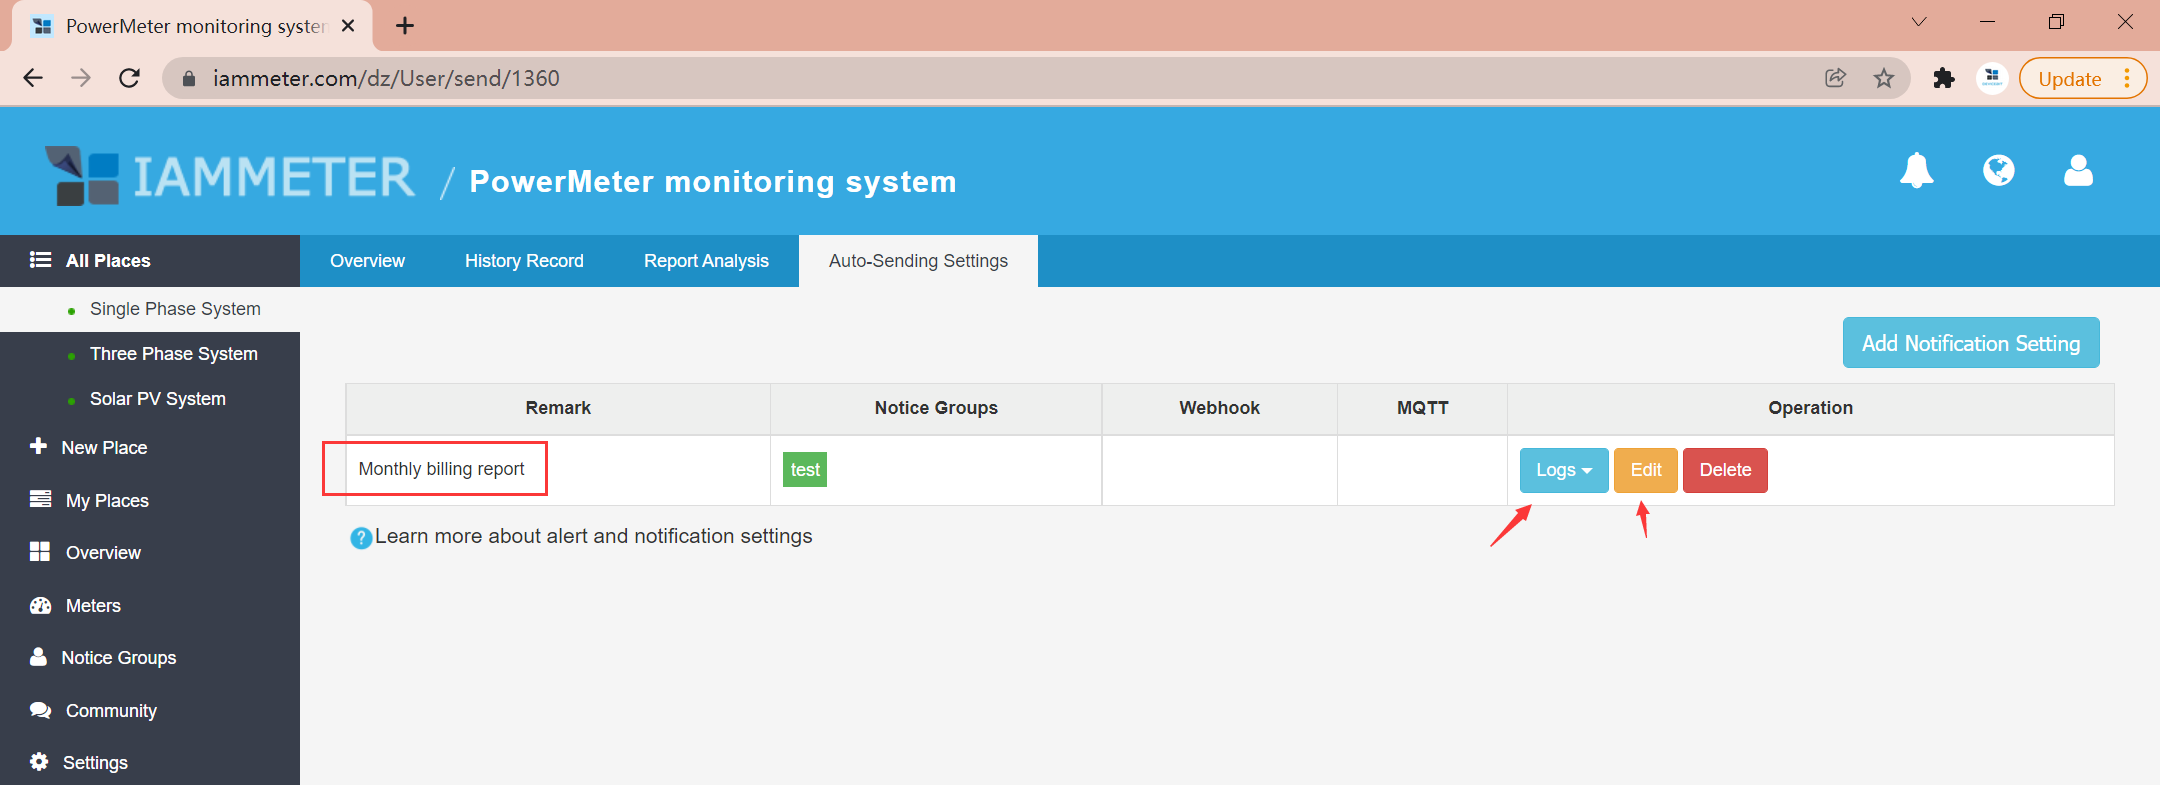
Figure 4. The screenshot shows the Logs entry for a monthly-report rule, not a power-alert event. Open your own power rule's log and check delivery at the receiving end.
If the investigation finds air conditioning left running, improve the closing checklist, then check whether consumption falls at the same measurement point and during the same hours.
Use Comparison Analysis on Time Basis to compare dates, or reuse the same after-hours groups. Compare equal numbers of comparable days and record overtime, weather and workload changes. Do not attribute every reduction to your intervention.
See consumption comparisons across dates. Keep a simple record:
| Record | Details to keep |
|---|---|
| Measurement and time | Site, channel, dates and after-hours window |
| Finding | When it happened and the equipment or operating cause |
| Action | Timer changes, closing checks or notification responsibilities |
| Follow-up | Like-for-like kWh changes, plus weather and workload effects |
The aim is to find, investigate, alert and review—not just view another chart.
Not monitoring yet? Explore the business electricity monitoring and alert solution for measurement scope, installation and meter selection. Already have a meter? Start by checking one complete working day.