

Real-Time Energy Monitoring and Power Alerts with 1-Second Data
Minute-level or hourly energy data is useful for electricity reports, but it can miss short power changes. A motor start, heater cycle, inverter fluctuation or unexpected load may last only a few seconds.
IAMMETER-Docker provides a local Data log & alarm dashboard that requests measurements from an IAMMETER energy meter every second. It displays voltage, current, active power and accumulated energy, and it can create alarm records when voltage, current or power crosses a configured threshold.
IAMMETER energy meter
        │
        │ Local network, 1-second refresh
        ▼
IAMMETER-Docker Data log & alarm
        │
        ├── Real-time voltage
        ├── Real-time current
        ├── Real-time active power
        ├── Accumulated energy
        └── Threshold alarm records
This page focuses on real-time monitoring and threshold alarms. For simple offline measurement storage and CSV retrieval, see the separate Offline Energy Datalogger solution.
Video: Real-time monitoring in IAMMETER-Docker
1. When Is 1-Second Energy Monitoring Useful?
A faster refresh rate is helpful when the objective is to observe electrical behavior rather than only calculate a monthly bill.
Typical uses include:
- observing short changes in household or commercial demand;
- checking the starting power of a motor, pump or compressor;
- identifying when a heater or other large load switches on;
- monitoring rapid solar inverter or grid-power changes;
- checking voltage variation under load;
- comparing current and power across three phases;
- recording when a measured value crosses an operational threshold;
- troubleshooting a control flow before deploying automation.
It is usually unnecessary to collect every value at one-second resolution for ordinary billing reports. Use this mode when the faster data leads to a specific diagnostic, monitoring or alerting benefit.
2. What This Feature Does—and Does Not Do
The Data log & alarm feature provides:
- one-second dashboard refresh from the local meter;
- voltage, current, active-power and energy display;
- separate threshold settings for each phase;
- historical alarm records;
- CSV export of the alarm records.
It is important to distinguish three different types of data:
| Data | Purpose | Retention/export |
|---|---|---|
| One-second dashboard values | Observe fast electrical changes | Displayed in the real-time dashboard |
| Alarm records | Record threshold events | Listed in Alarm logs and exportable as CSV |
| Offline measurement CSV files | Retain local measurement data for later retrieval | Provided by the newer mounted /app/datalogger workflow |
The CSV export shown in this guide is for alarm records. For continuous offline measurement CSV files, follow IAMMETER-Docker offline datalogger mode.
Threshold alarms in monitoring software are not a replacement for circuit breakers, protective relays or certified electrical protection equipment. Do not use this feature as the only safety mechanism for overcurrent, overvoltage or equipment protection.
3. Requirements
Before configuring real-time monitoring, confirm that:
- IAMMETER-Docker is already deployed and accessible;
- the Docker host and meter are on mutually reachable networks;
- the meter has a stable local IP address or DHCP reservation;
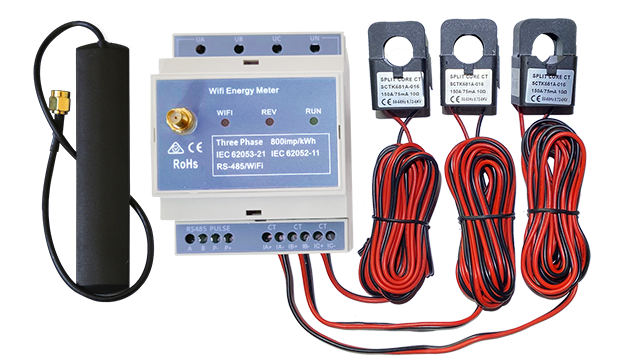
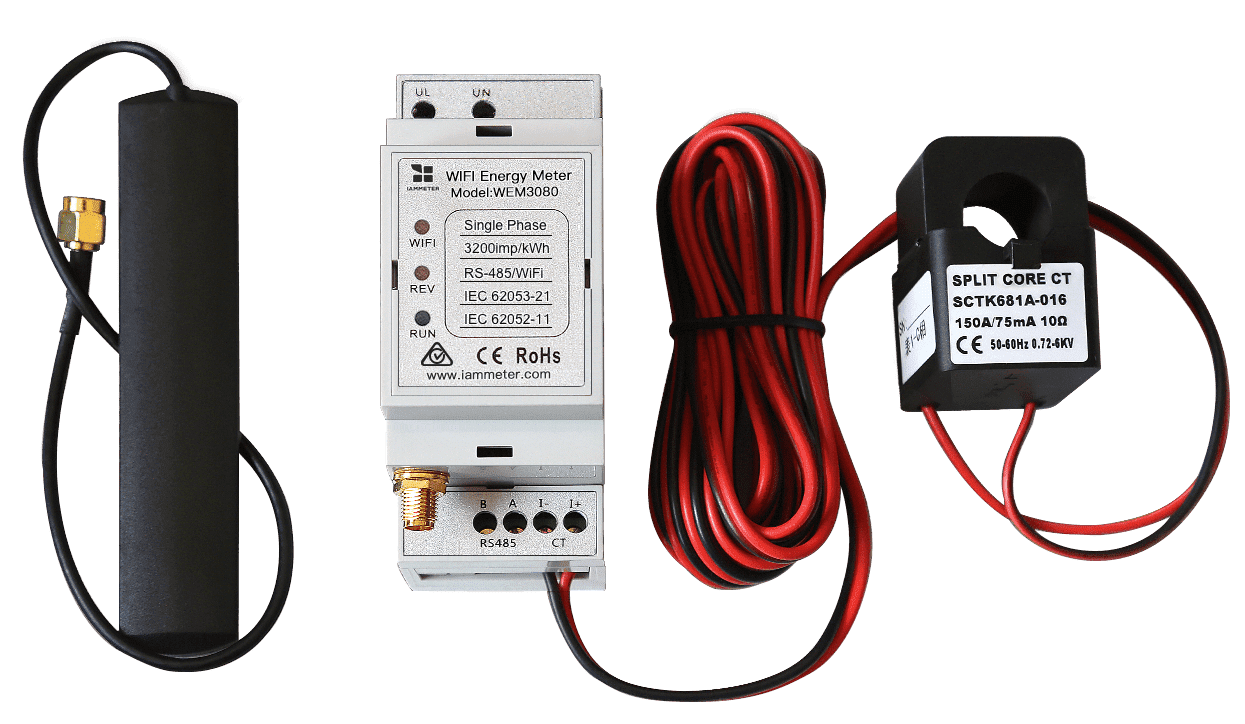
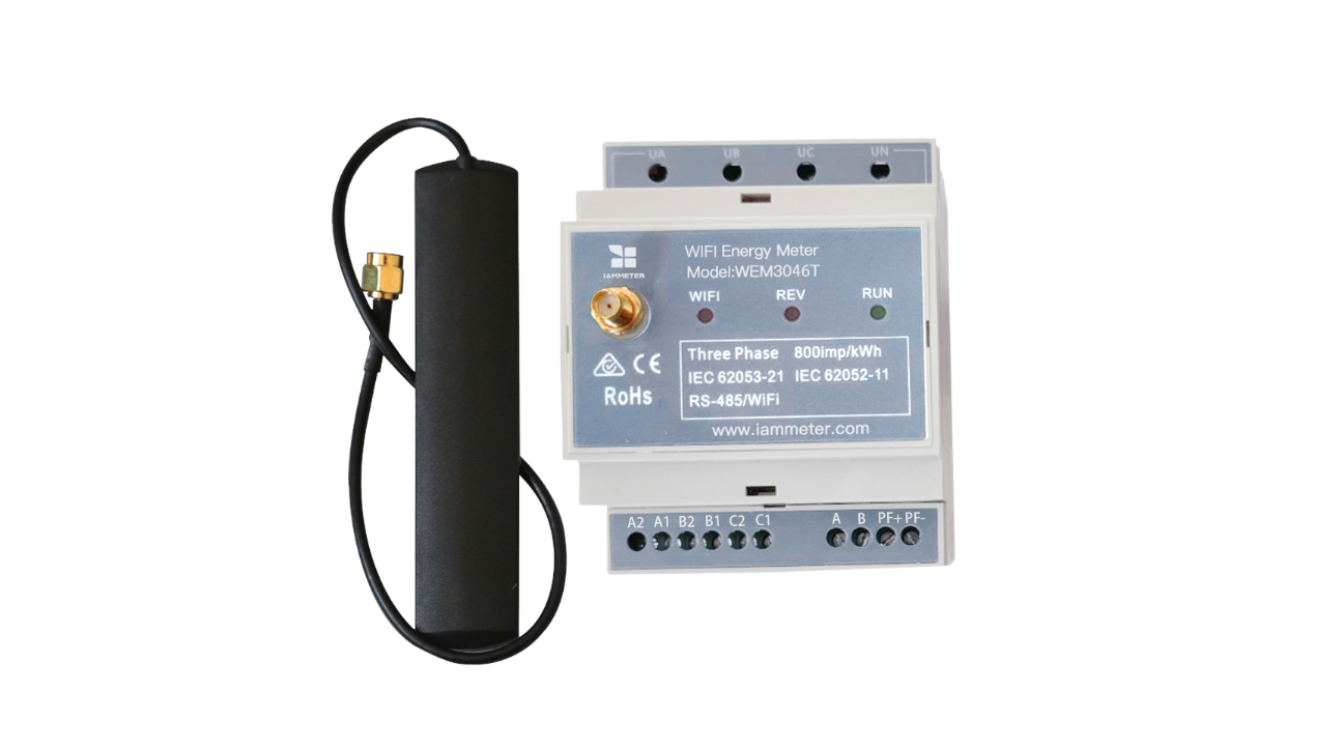
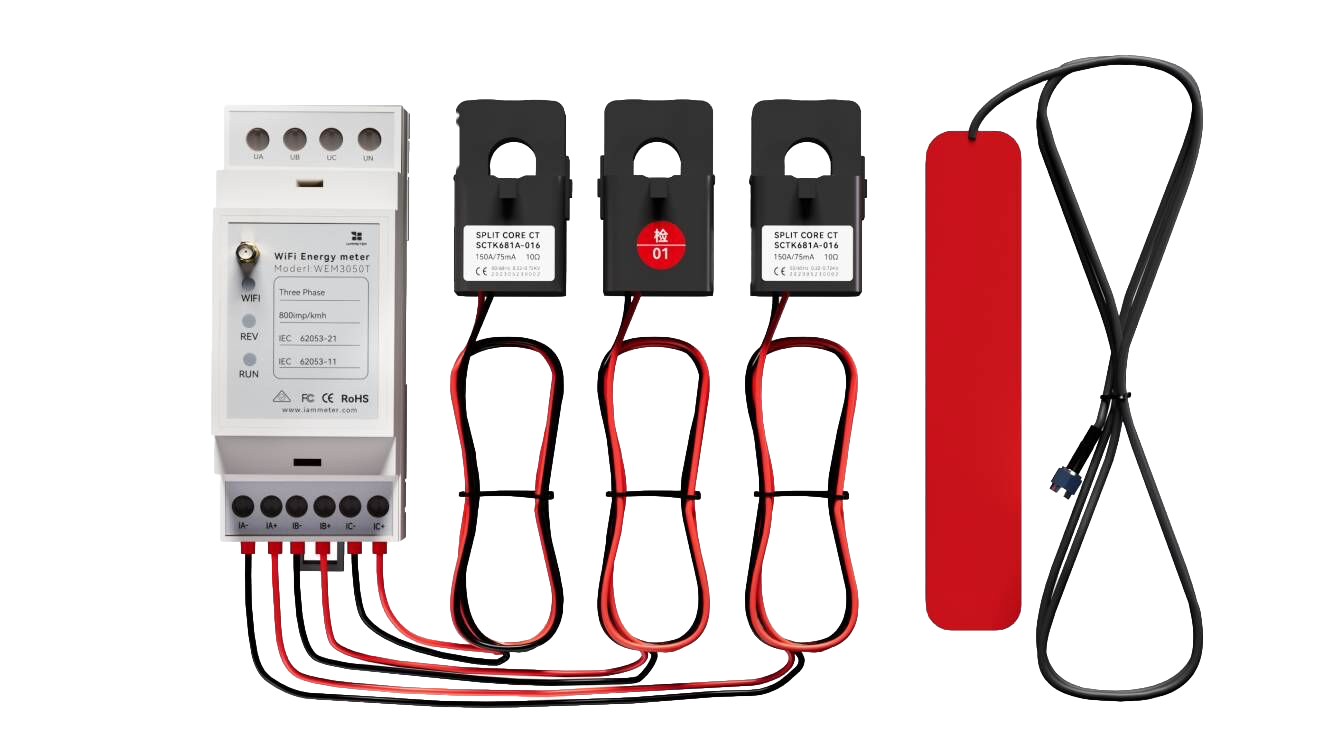
- the meter model and phase count are known;
- the Docker host has the correct timezone;
- the default IAMMETER-Docker password has been changed;
- the meter is installed with the correct CT direction and wiring.
For container installation and first-time setup, see Self-Hosted Energy Monitoring with Docker.
4. Open the Data Log & Alarm Module
Sign in to IAMMETER-Docker and open:
Extension → Data log & alarm
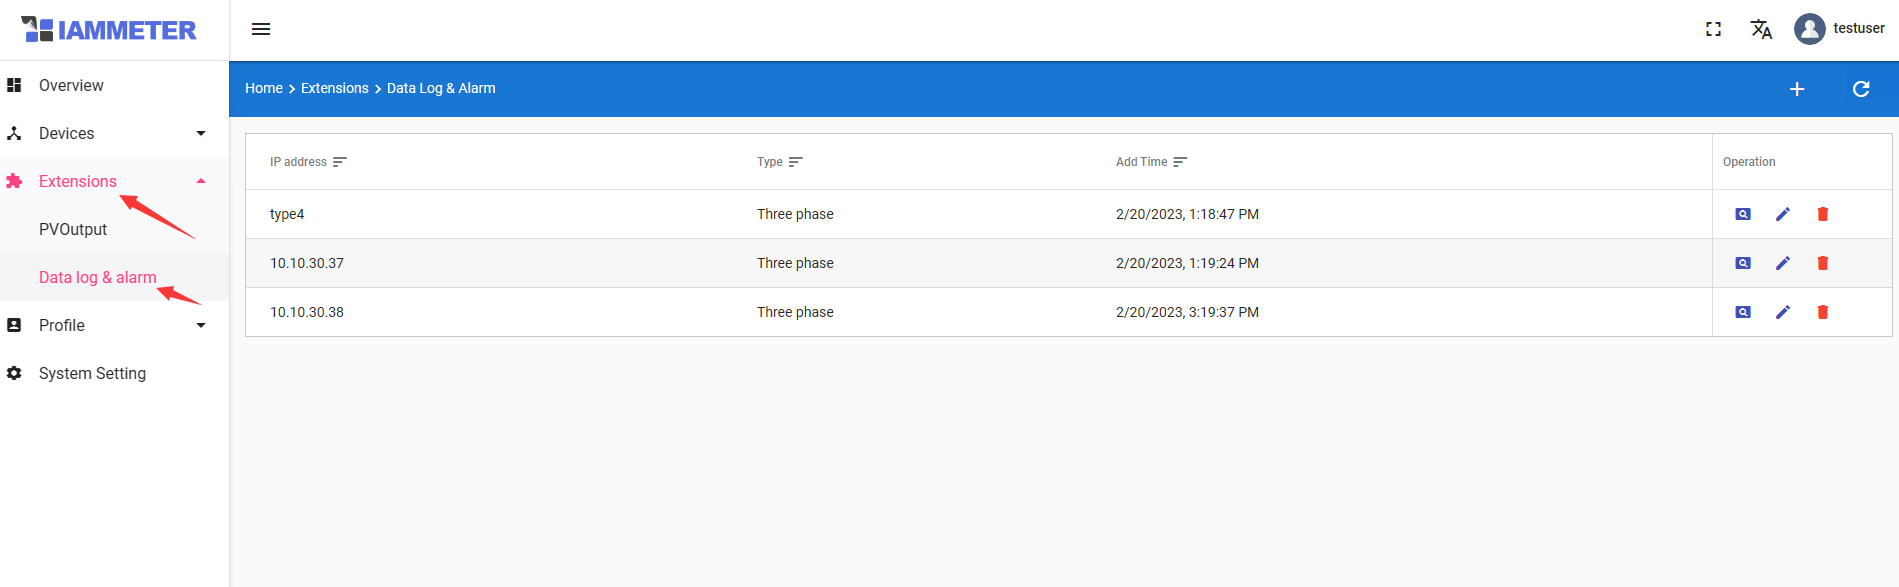
This module uses the meter's local IP address for real-time access. The Docker host must be able to reach that IP over the LAN.
5. Add an Energy Meter for Real-Time Monitoring
5.1 Add the meter
- Click the + icon.
- Enter the local IP address of the energy meter.
- Select the correct meter type: single-phase or three-phase.
- Save the configuration.
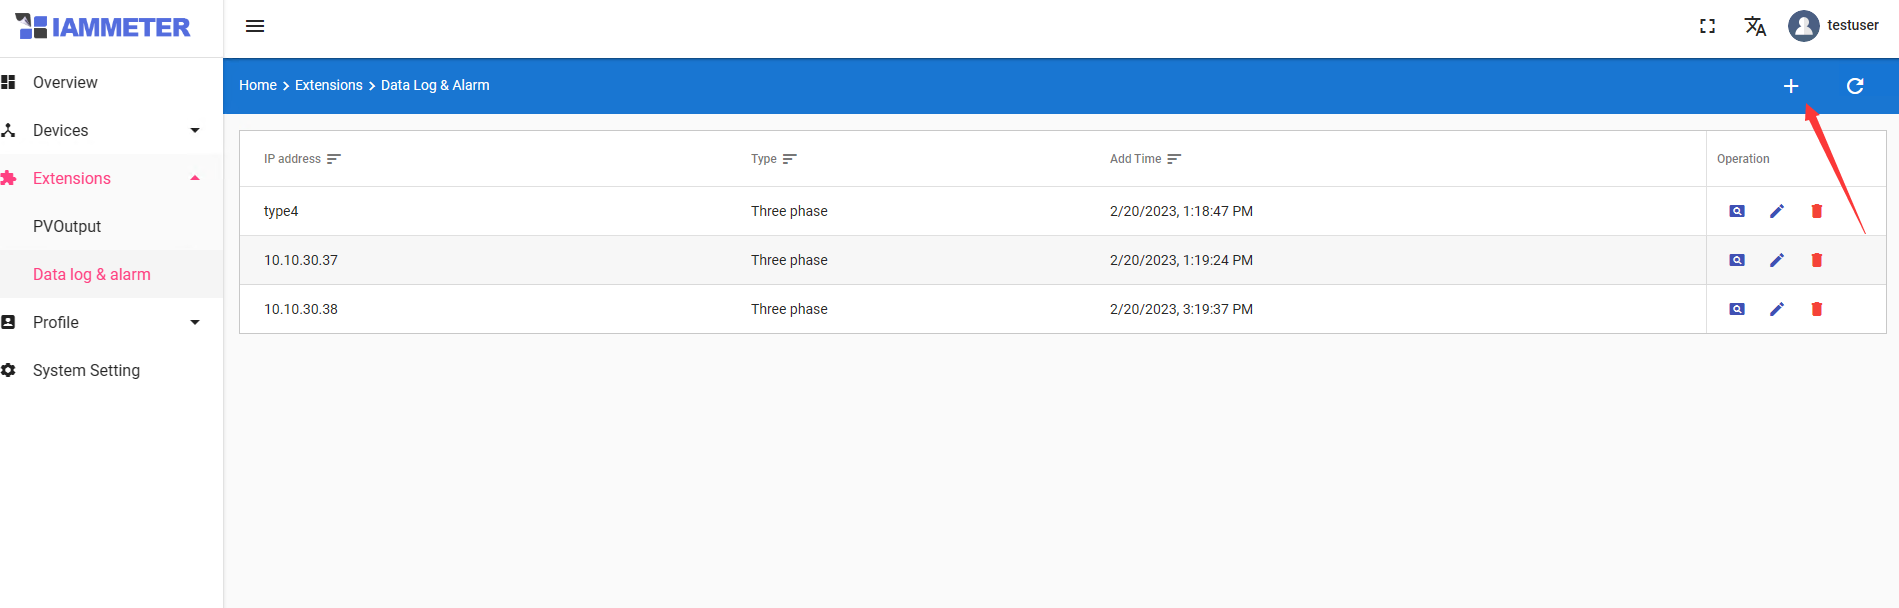
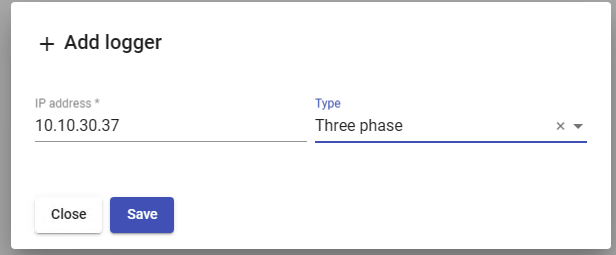
The meter appears in the list after it has been added. Click View to open the real-time dashboard.

5.2 Verify the connection
Before configuring alarms, verify:
- the meter remains reachable;
- values refresh rather than remaining static;
- voltage is reasonable for the electrical system;
- current and active power respond when a known load changes;
- the number of displayed phases matches the meter configuration;
- active-power direction is understood for bidirectional grid or solar monitoring.
If the meter has a dynamic DHCP address, reserve its IP in the router. Otherwise, the real-time module may stop working after the address changes.
6. Read the Real-Time Dashboard
The dashboard refreshes the following values every second:
- voltage;
- current;
- active power;
- accumulated energy (kWh).
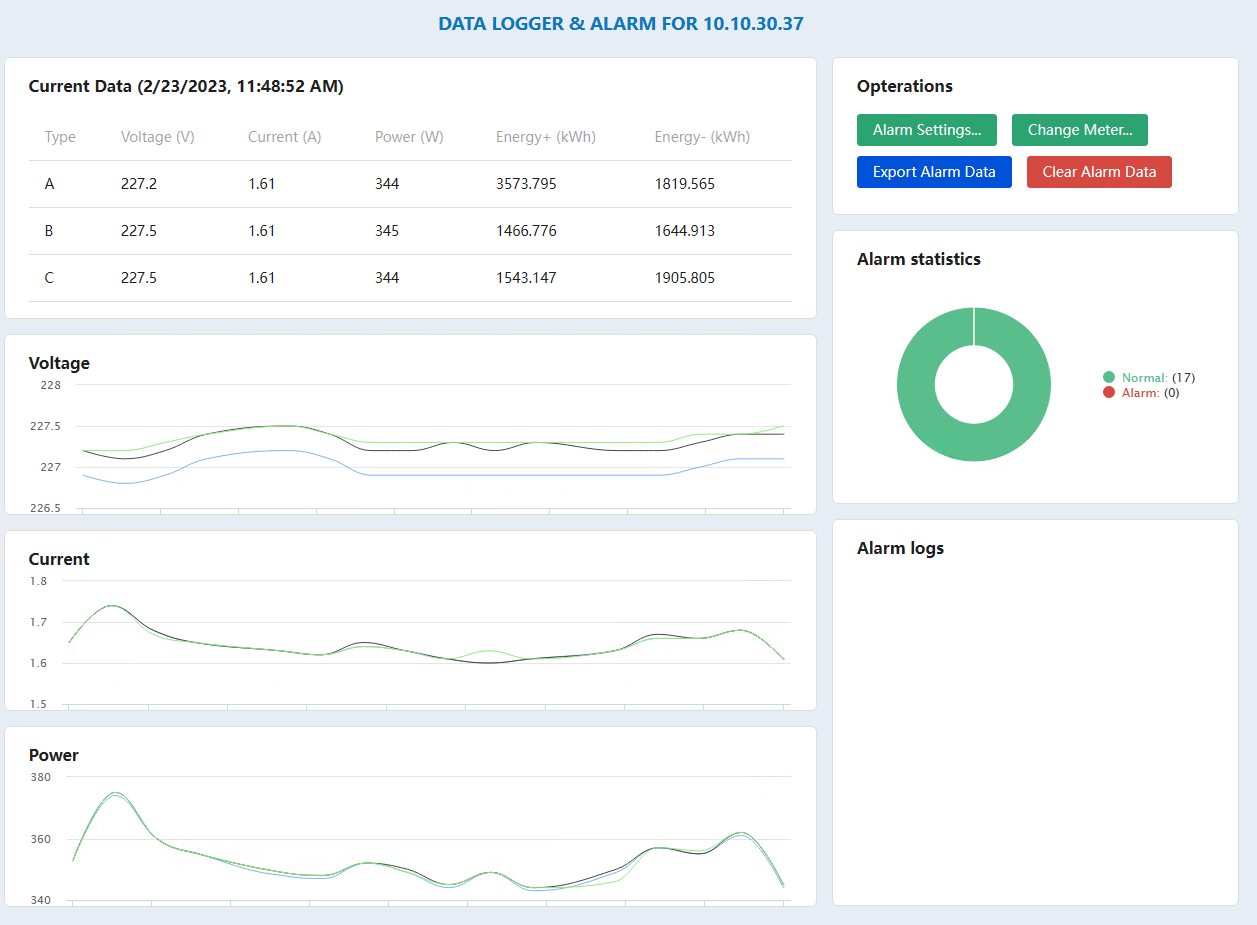
For a three-phase meter, review each phase separately. A total power value can hide a phase-specific issue, such as one phase carrying substantially more load than the others.
How to interpret rapid changes
- A short active-power increase may indicate a load starting.
- A repeating power pattern may indicate cycling equipment.
- Current rising while voltage falls may indicate a supply or wiring issue that requires qualified investigation.
- Negative active power may represent export, depending on CT direction and the monitored circuit.
- A changing kWh value represents accumulated energy; use active power to examine second-by-second demand.
Treat the dashboard as a diagnostic view. Confirm unusual readings against wiring, CT orientation and another trusted measurement before drawing a conclusion.
7. Configure Voltage, Current and Power Alarms
Open:
Operations → Alarm settings
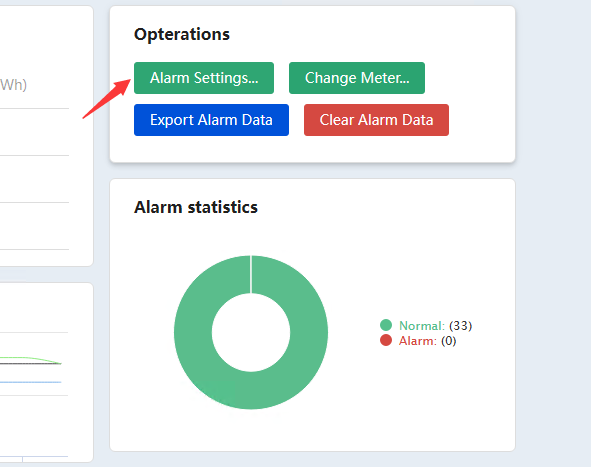
Enter the required voltage, current and active-power thresholds for each phase.
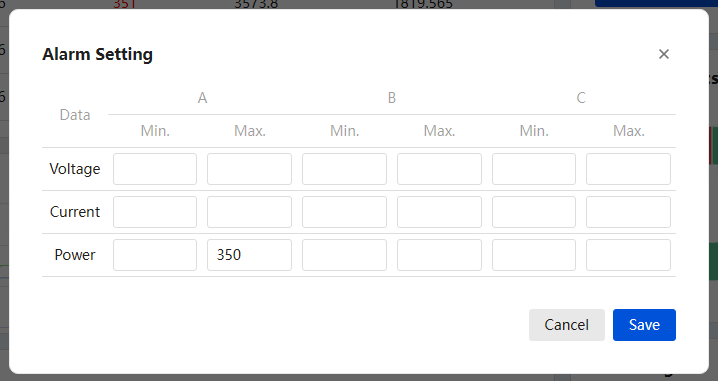
7.1 Choose meaningful thresholds
A useful threshold should identify an abnormal or operationally important state without creating constant noise.
Examples:
- power above the expected maximum demand of a circuit;
- current above the normal operating range of a monitored load;
- voltage outside the range expected for the site;
- unexpected reverse or export power, when the configured alarm supports the relevant direction;
- a phase-specific threshold for detecting an imbalanced load pattern.
Do not copy a threshold from another installation. Appropriate values depend on supply voltage, meter placement, CT rating, circuit capacity, equipment behavior and local electrical requirements.
7.2 Test before relying on alarms
- Start with a threshold that can be crossed safely by a known load.
- Confirm that the live value crosses it.
- Check that an alarm record is created.
- Return the threshold to the intended value.
- Review false alarms over a representative operating period.
When a reading regularly sits close to the threshold, small normal fluctuations can create many alarm records. Adjust the operational threshold based on measured behavior while keeping electrical safety limits separate.
8. Review Historical Alarm Records
Open Alarm logs to review recorded threshold events.
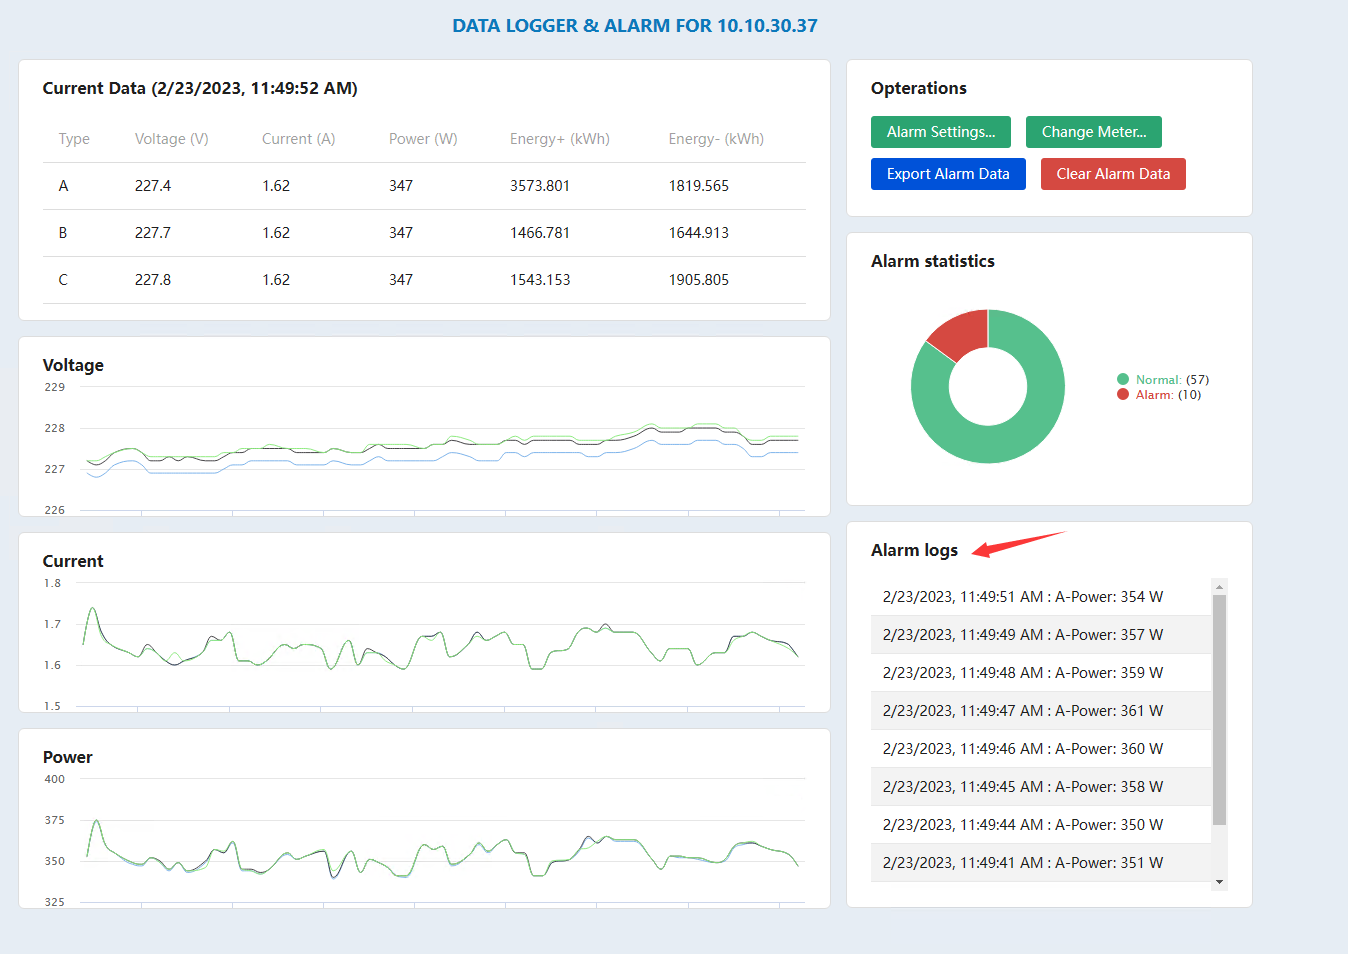
Alarm history can help answer questions such as:
- When did a high-power event occur?
- Which phase crossed the threshold?
- Was the event isolated or repetitive?
- Did it coincide with a known appliance or production schedule?
- Did voltage and current change at the same time?
An alarm record tells you that a configured condition was met. It does not by itself identify the appliance or root cause. Use the timestamp, phase and measured value together with site knowledge.
9. Export Alarm Logs to CSV
Alarm records can be exported as a CSV file for engineering review, incident records or further analysis.
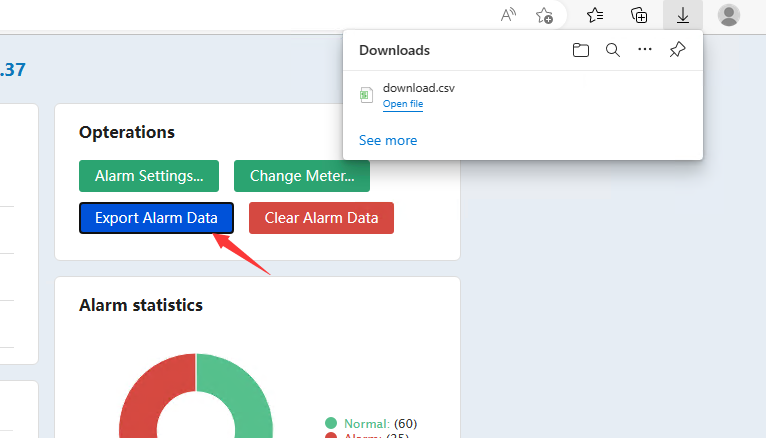
After export:
- keep the timezone with the dataset;
- document the threshold configuration used during the period;
- retain the meter identity and monitored circuit;
- avoid combining logs from different phases without a phase field;
- compare events with operational schedules or other system logs.
Again, this export contains alarm records. It is different from the continuous measurement CSV files provided by the offline datalogger workflow.
10. Real-Time Alarms or Offline Datalogger Mode?
| Requirement | Recommended IAMMETER-Docker feature |
|---|---|
| Watch voltage, current and power change every second | Data log & alarm real-time dashboard |
| Record when a value crosses a threshold | Data log & alarm threshold settings |
| Export historical alarm events | Alarm log CSV export |
| Store continuous measurement CSV files without Internet | Offline datalogger mode with /app/datalogger mounted |
| Download or delete stored measurement CSV files | /datalogger web page |
| Copy measurement CSV files using USB at an isolated site | Router-based offline datalogger workflow |
These functions can serve different projects. Choose based on whether the main need is fast observation and threshold events or simple offline data retention.
11. Troubleshooting
The meter cannot be added or viewed
- Confirm that its IP address is correct.
- Test reachability from the Docker host network.
- Check whether Wi-Fi client isolation blocks communication.
- Reserve the meter IP in the router.
- Confirm the correct single-phase or three-phase selection.
Values do not refresh every second
- Check LAN latency and Wi-Fi signal quality.
- Confirm that another high-frequency client is not overloading the local access path.
- Review IAMMETER-Docker container logs.
- Test the meter's local interface separately.
Too many alarm records are created
- Compare the threshold with the normal operating range.
- Check for a load that naturally cycles near the limit.
- Confirm that the correct phase and unit are being evaluated.
- Investigate unstable or implausible measurements before simply raising the threshold.
Active power has the unexpected sign
- Confirm CT direction and wiring.
- Identify whether the channel monitors Grid, Inverter or Load.
- Test during a known import or export condition.
12. Good Practice for Real-Time Power Monitoring
- Use a stable IP address for each meter.
- Test one meter before deploying several high-frequency polling clients.
- Keep the Docker host, meter and browser on a reliable local network.
- Set the correct timezone before reviewing event timestamps.
- Define thresholds from observed operating data.
- Keep monitoring alarms separate from electrical protection.
- Export and retain alarm records when they support an operational process.
- Use the offline datalogger when continuous CSV measurement retention is the actual requirement.
13. Version and Update Notes
The Data log & alarm dashboard was introduced in IAMMETER-Docker V2.1. The original 2023 workflow and screenshots are retained because they document the feature's menu, meter setup, threshold configuration and alarm-log export.
Later IAMMETER-Docker releases added a separate offline CSV datalogger workflow. In V2.4, mounting /app/datalogger enables continuous CSV storage and the /datalogger management page. That newer feature does not change the distinction between alarm-log CSV export and measurement-data CSV storage explained above.
14. Related Resources
- Energy Monitoring Alerts & Automation
- Power Threshold Alerts for High Load and Peak Demand Monitoring
- Deploy IAMMETER-Docker
- Advanced IAMMETER-Docker: MQTT and MySQL
- Offline Energy Datalogger solution
- IAMMETER-Docker Datalogger feature article
- Use an energy meter without Internet
- IAMMETER-Docker image
Last updated: July 17, 2026.