


Real-time Energy Data Subscription via MQTT Broker (2025 Edition)
1. Introduction
IAMMETER-Cloud is a professional energy monitoring and photovoltaic management platform. In addition to its powerful visualization and reporting functions, IAMMETER-Cloud also provides flexible data interfaces. This allows users with customized requirements to use IAMMETER-Cloud as a data middleware, retrieving data programmatically through code.
There are two main ways to obtain data from IAMMETER-Cloud using code:
- Subscribe to data via IAMMETER’s MQTT Broker (the focus of this article)
- Call IAMMETER-Cloud’s official APIs
This guide explains how to subscribe to IAMMETER MQTT topics, interpret data structures (for both single-phase and three-phase meters), and implement a working Python and Node.js examples.
2. IAMMETER MQTT Broker Overview
Note: The IAMMETER MQTT Broker was originally designed as a development and testing service for convenience and is not part of the standard IAMMETER-Cloud offering (although it has been stable and running for over 5 years). For production or large-scale deployments, we recommend setting up your own MQTT broker.
IAMMETER MQTT Broker Configuration
| Parameter | Description |
|---|---|
| Broker address | mqtt.iammeter.com |
| Port | 1883 (non-SSL) |
| Username / Password | Must be created in IAMMETER Cloud → Settings → MQTT Settings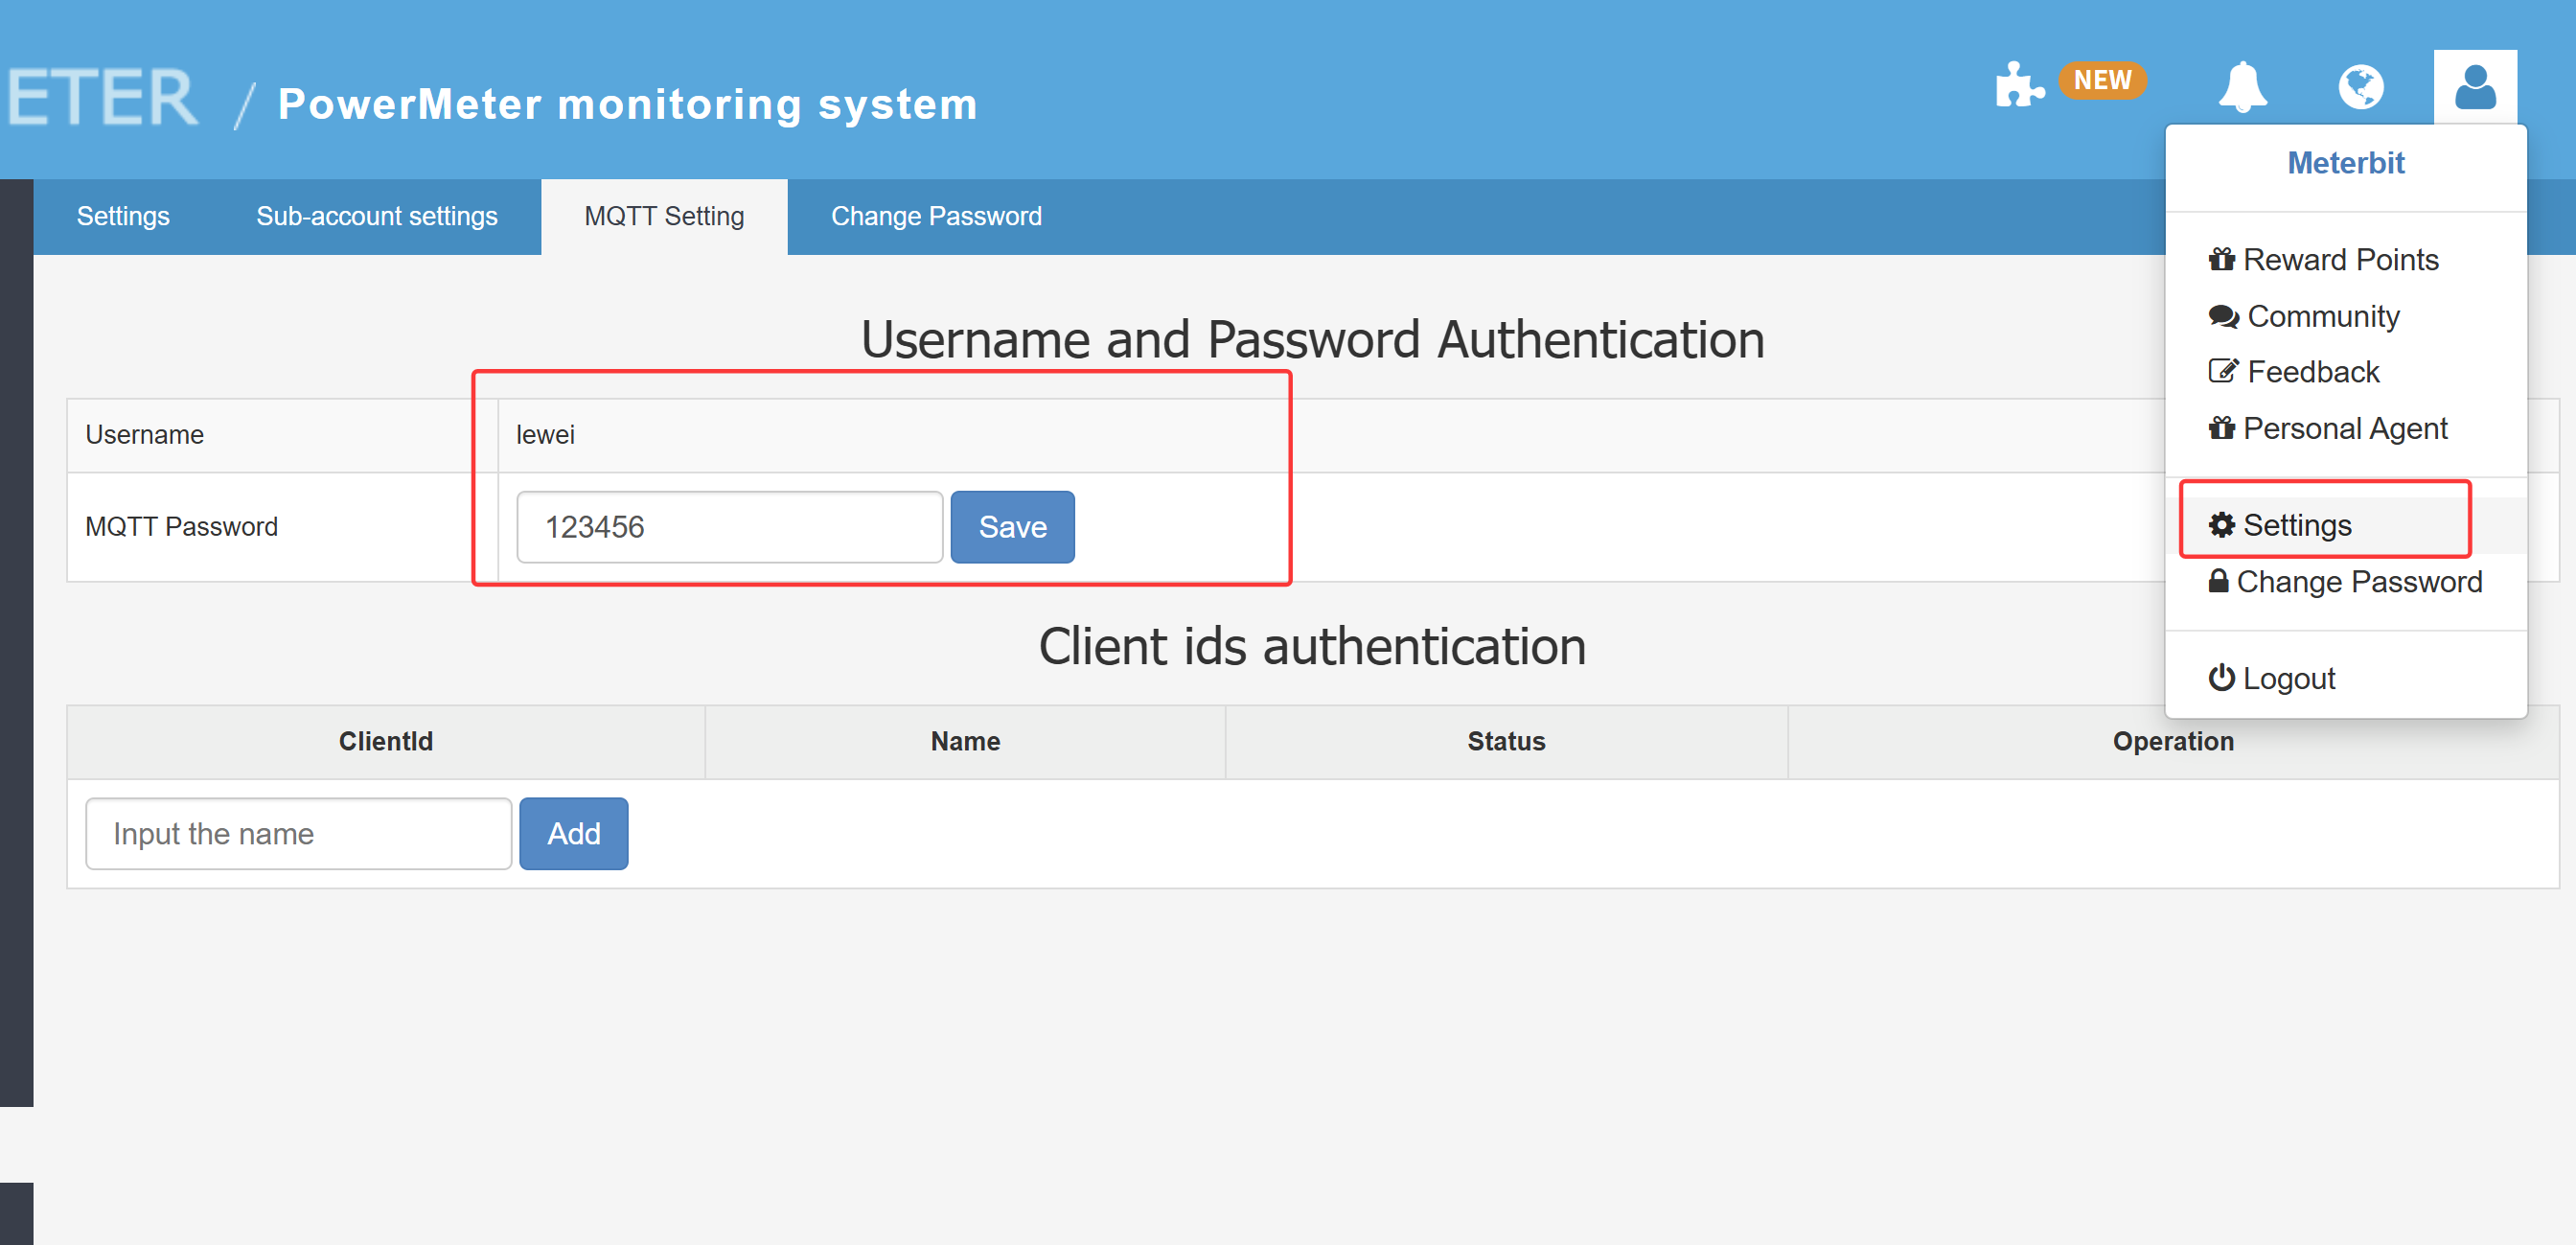 |
| Topic format | device/{SN}/realtime |
| Payload format | JSON |
⚠️ Important: Do not use your IAMMETER Cloud login credentials here. You need to create a dedicated MQTT username and password in the IAMMETER Cloud dashboard.
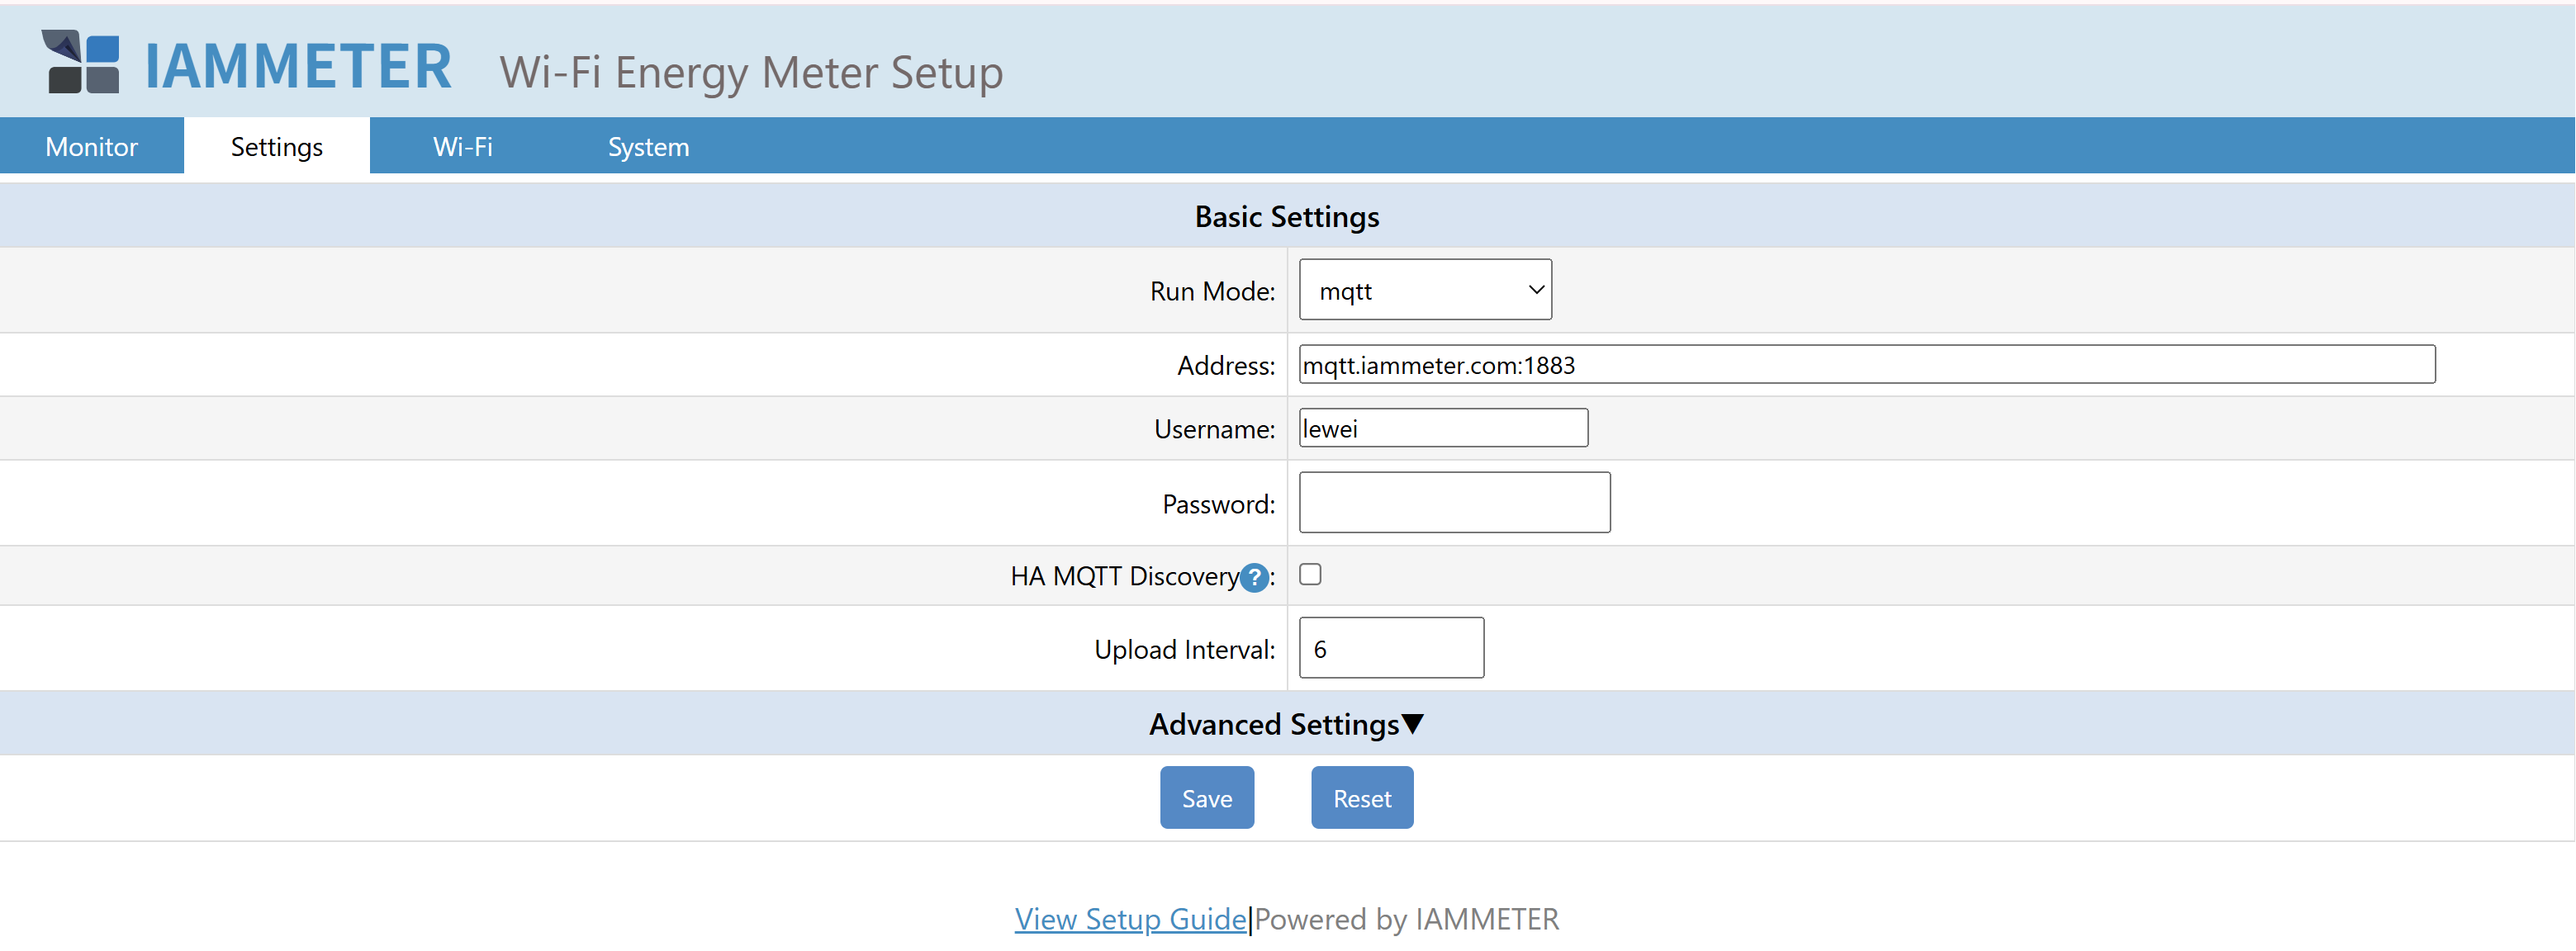
Configure IAMMETER Meter to Use MQTT Mode
Set your IAMMETER meter to MQTT upload mode (see firmware configuration guide) and enter the IAMMETER MQTT Broker parameters.
3. MQTT Topic Format
Each IAMMETER device publishes its real-time data under the following topic:
device/{SN}/realtime
Where {SN} is the serial number of your meter.
For example, if your device SN is DA2BED94, the topic will be:
device/DA2BED94/realtime
You can subscribe to this topic to receive continuous real-time measurement data.
4. Data Format
4.1 Single-phase Meter Data Format
A single-phase IAMMETER meter publishes real-time data in JSON format as follows:
{
  "method": "1-272",
  "mac": "B0F8932A295C",
  "version": "i.91.062T6",
  "server": "em",
  "SN": "DA2BED94",
  "Data": [227.02, 1.81, 296.0, 21699.98, 0.00, 50.01, 0.72]
}
| Index | Field | Description | Unit |
|---|---|---|---|
| 1 | Voltage | Current line voltage | V |
| 2 | Current | Current line current | A |
| 3 | Power | Active power | W |
| 4 | Forward Energy | Imported energy (consumed) | kWh |
| 5 | Reverse Energy | Exported energy (feed-in, solar) | kWh |
| 6 | Frequency | Grid frequency | Hz |
| 7 | Power Factor | Current power factor | PF |
🟢 Notes:
- Positive power → energy consumption
- Negative power → energy export (e.g., solar feed-in)
4.2 Three-phase Meter Data Format (WEM3080T / WEM3046T / WEM3050T)
Three-phase IAMMETER meters publish data in a similar JSON format, with three arrays corresponding to each phase.
{
  "method": "4-9",
  "mac": "849DC2CEC625",
  "version": "i.91.062T6",
  "server": "em",
  "SN": "CB0A0CFB",
  "EA": {
    "Reactive": [
      [-111.0, 0.000, 176.750],
      [-113.0, 0.000, 179.110],
      [-114.0, 36.120, 144.410]
    ]
  },
  "Datas": [
    [225.9, 1.260, 194.0, 305.110, 0.000, 49.99, 0.87],
    [225.8, 1.260, 193.0, 302.690, 0.000, 49.99, 0.86],
    [225.9, 1.260, 192.0, 300.890, 0.000, 49.99, 0.86]
  ]
}
Datas is a list containing three arrays, each corresponding to phase A, B, and C.
Each inner array has the same structure as the single-phase Data array.
| Index | Field | Description | Unit |
|---|---|---|---|
| 1 | Voltage | Phase voltage | V |
| 2 | Current | Phase current | A |
| 3 | Power | Active power | W |
| 4 | Forward Energy | Imported energy | kWh |
| 5 | Reverse Energy | Exported energy | kWh |
| 6 | Frequency | Grid frequency | Hz |
| 7 | Power Factor | Phase power factor | PF |
In addition to the real power data, when reactive power measurement is enabled, you will also see the EA section as follows:
"EA": {
  "Reactive": [
    [-111.0, 0.000, 176.750],
    [-113.0, 0.000, 179.110],
    [-114.0, 36.120, 144.410]
  ]
}
This section shows reactive measurement data, which appears only when the reactive test function is enabled (see screenshot below).
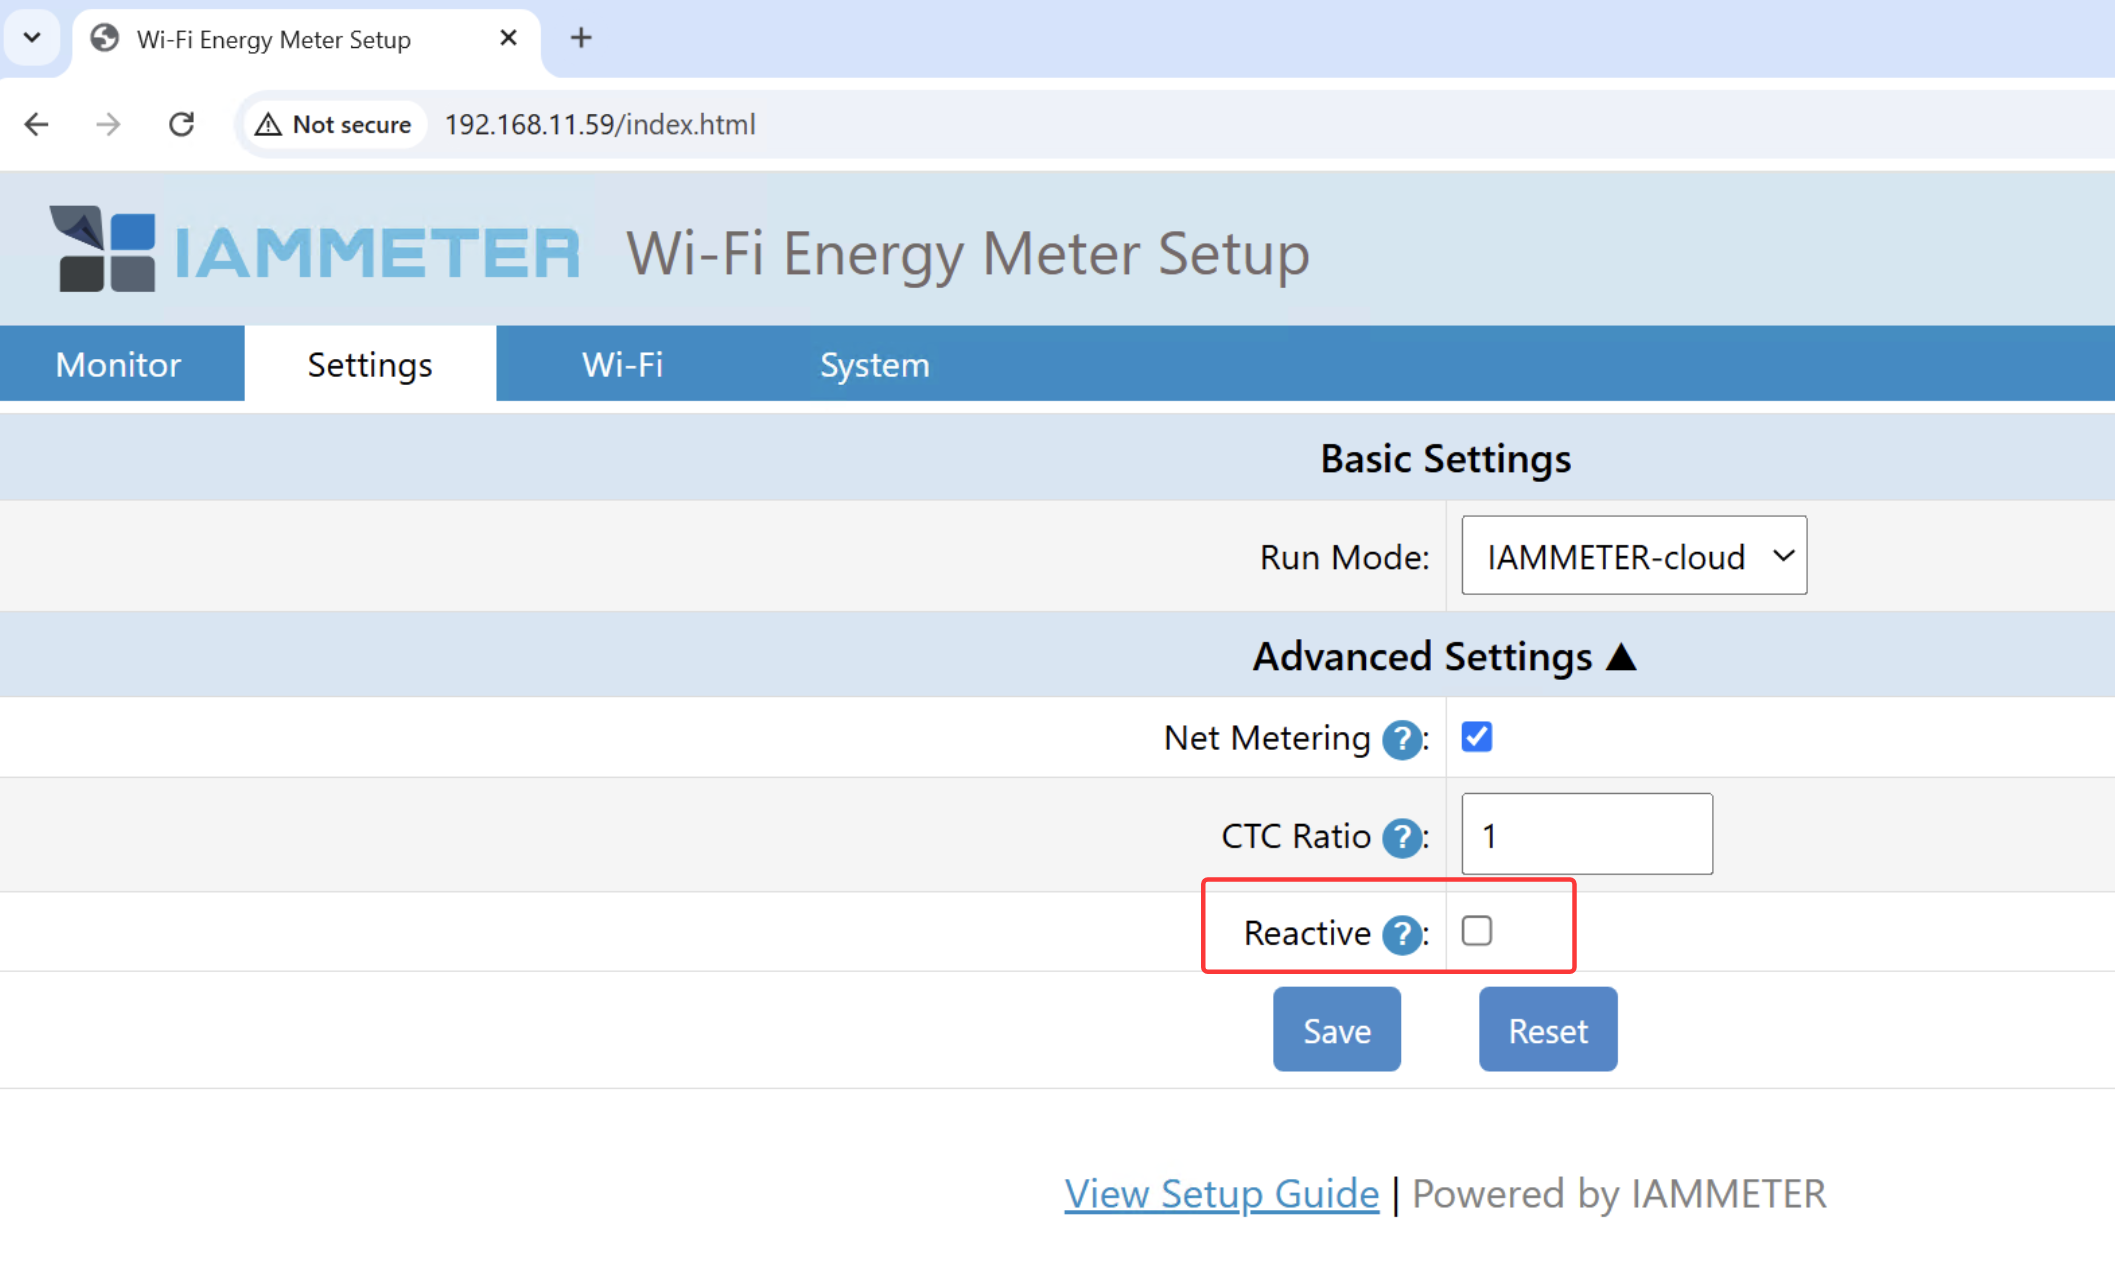
Each array represents the three phases (A, B, C), showing reactive power (Q in kVar) and reactive energy (kVARh).
Q (kVar): Reactive power — positive = inductive, negative = capacitive kVARh: Reactive energy — each phase includes two kVARh values: one for inductive load and one for capacitive load.
5. Python Example: Subscribing to Real-time Data
Below is a working Python script using the paho-mqtt library.
import paho.mqtt.client as mqtt
import json

# MQTT Broker configuration
MQTT_BROKER = "mqtt.iammeter.com"
MQTT_PORT = 1883
MQTT_USER = "your_mqtt_username"  # Set in IAMMETER Cloud → MQTT Settings
MQTT_PASS = "your_mqtt_password"
TOPIC = "device/DA2BED94/realtime"  # Replace with your own device SN

# Callback when connected to the broker
def on_connect(client, userdata, flags, rc):
    if rc == 0:
        print("✅ Connected to IAMMETER MQTT Broker successfully")
        client.subscribe(TOPIC)
        print(f"📡 Subscribed to topic: {TOPIC}")
    else:
        print(f"❌ Connection failed with code {rc}")

# Callback when a message is received
def on_message(client, userdata, msg):
    payload = json.loads(msg.payload.decode())
    print("📊 Received real-time data:")
    print(json.dumps(payload, indent=2, ensure_ascii=False))

# Initialize MQTT client
client = mqtt.Client()
client.username_pw_set(MQTT_USER, MQTT_PASS)
client.on_connect = on_connect
client.on_message = on_message

# Connect to the broker and start the loop
client.connect(MQTT_BROKER, MQTT_PORT, 60)
client.loop_forever()
6. Node.js Example
We recommend trying this interesting open-source project: It uses Node.js to subscribe to real-time data from the IAMMETER MQTT broker and visualize it in a web UI, creating a cool real-time dashboard.
🔗 https://github.com/lewei50/iammeterJS
7. Practical Use Cases
- Smart Home Automation Integrate real-time power data into Home Assistant or Node-RED to trigger automation actions (e.g., start a heater when solar generation is high).
- Local Data Visualization Store incoming MQTT data in InfluxDB and visualize it with Grafana dashboards.
- Private Cloud or Edge Computing Retrieve real-time power data directly via MQTT for custom analytics or control logic without relying on IAMMETER Cloud.
8. Troubleshooting
| Issue | Possible Cause / Solution |
|---|---|
| Cannot connect to broker | Check if your MQTT username/password are correctly set in IAMMETER Cloud. |
| No data received | Verify your topic format (device/{SN}/realtime) and ensure the meter is online. |
| Data delay | Check your network stability or Wi-Fi signal strength. |
| Multiple meters | You can subscribe to multiple topics simultaneously (one per SN). |
9. Conclusion
Using IAMMETER MQTT Broker, you can easily access real-time energy data streams from your IAMMETER devices. It’s a powerful and flexible method to build local dashboards, smart automations, or AI-based energy optimization systems.
📘 References
- IAMMETER Firmware & Communication Features
- IAMMETER Cloud and MQTT API Documentation
- Develop your own Energy Monitoring Dashboard using NodeJS
Would you like me to make a Markdown-formatted blog post version (ready to publish on the IAMMETER official blog, with syntax highlighting and embedded image links intact)?
")
")
")
")