


Manipulate the power chart directly from the app. The firmware of the Wi-Fi energy meter that supports Modbus/TCP.
Manipulate the power chart directly in the APP
Video tutorial: Analyze your energy data directly from the power chart in the app of IAMMETER
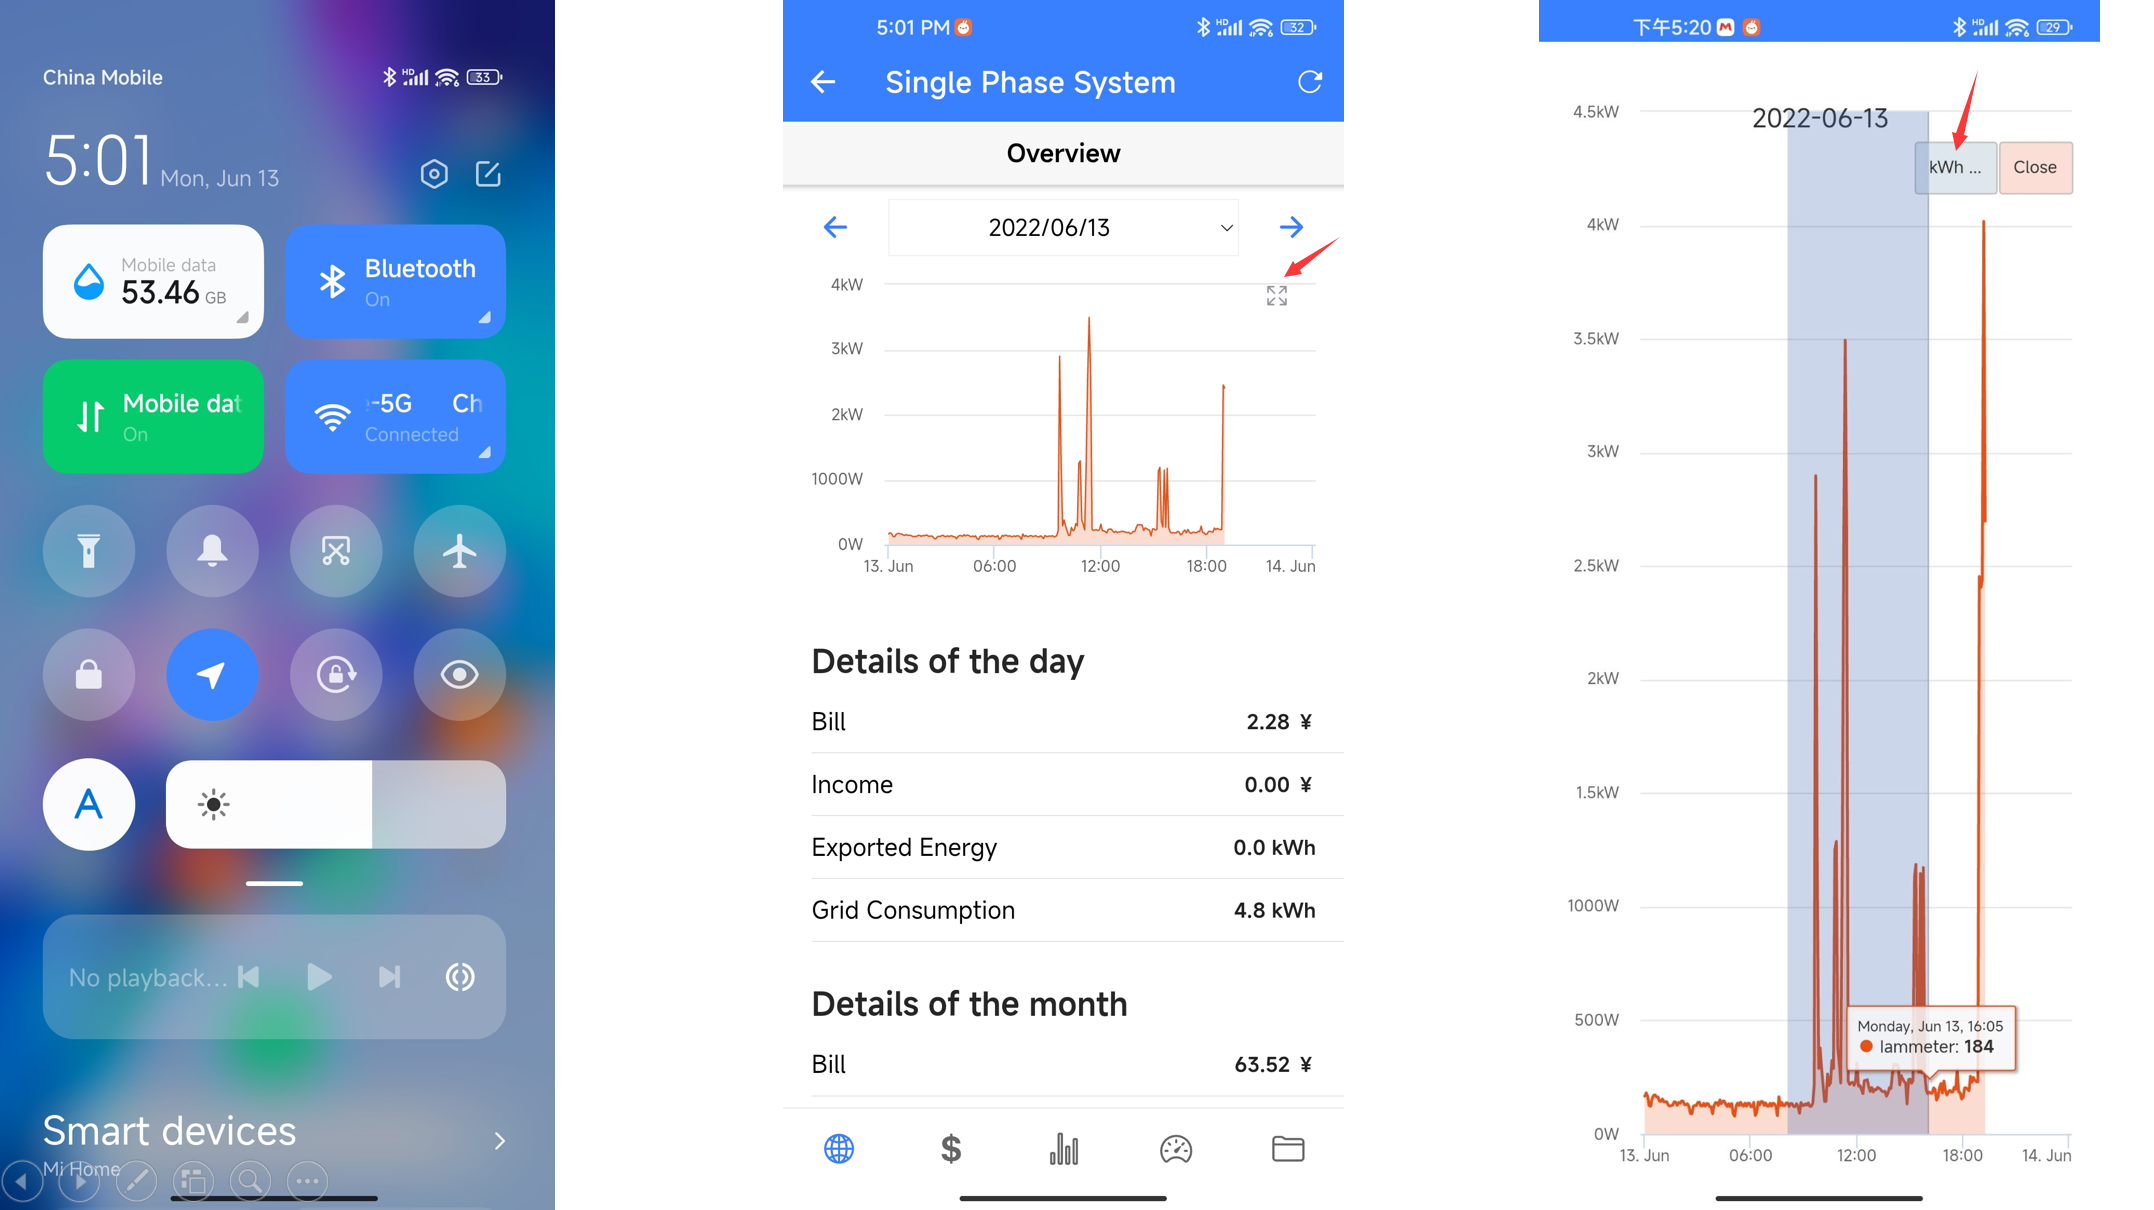
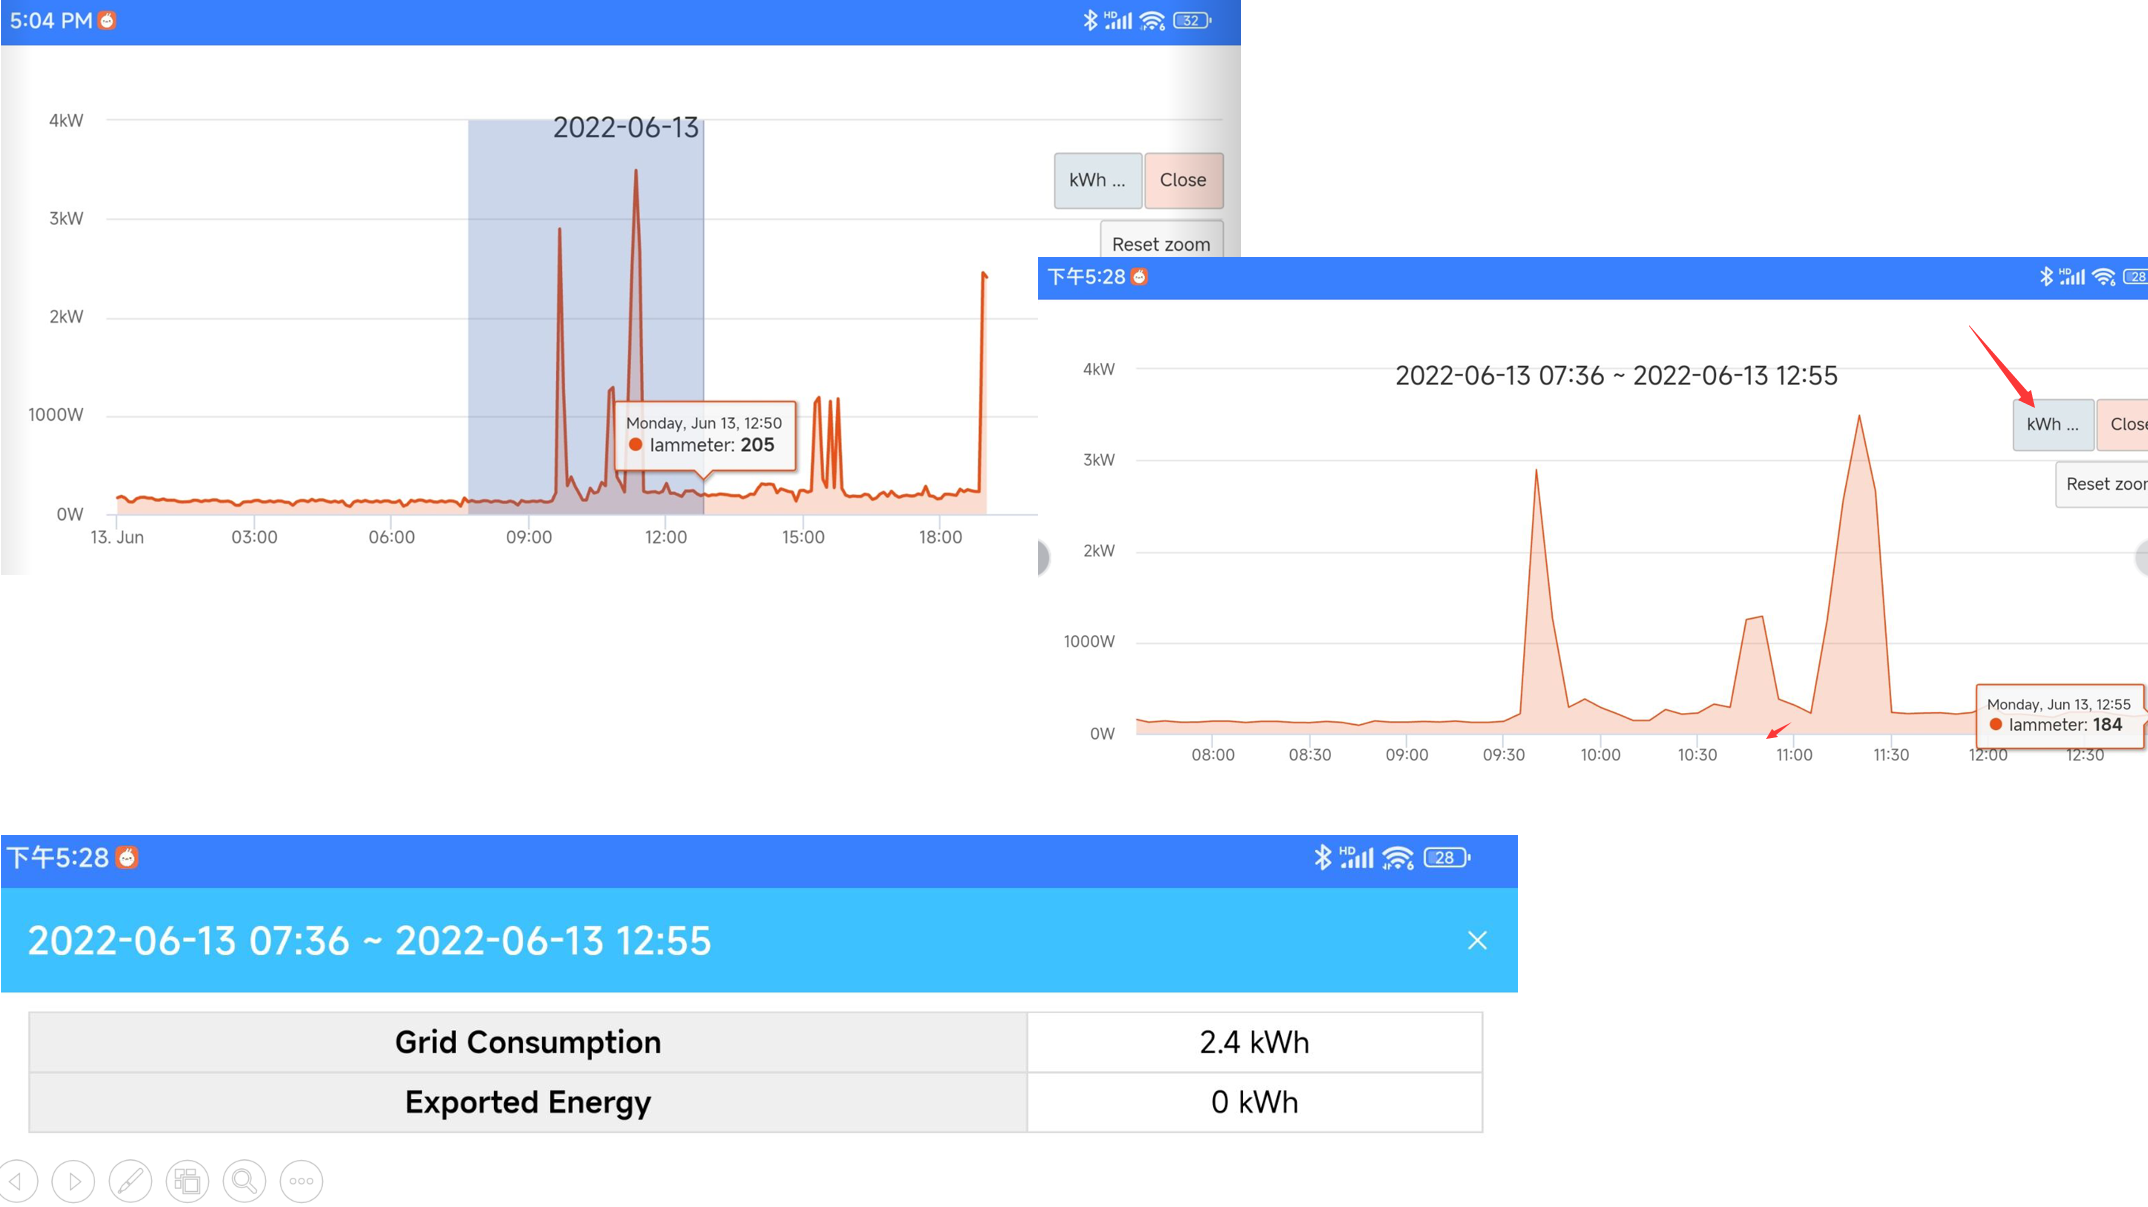
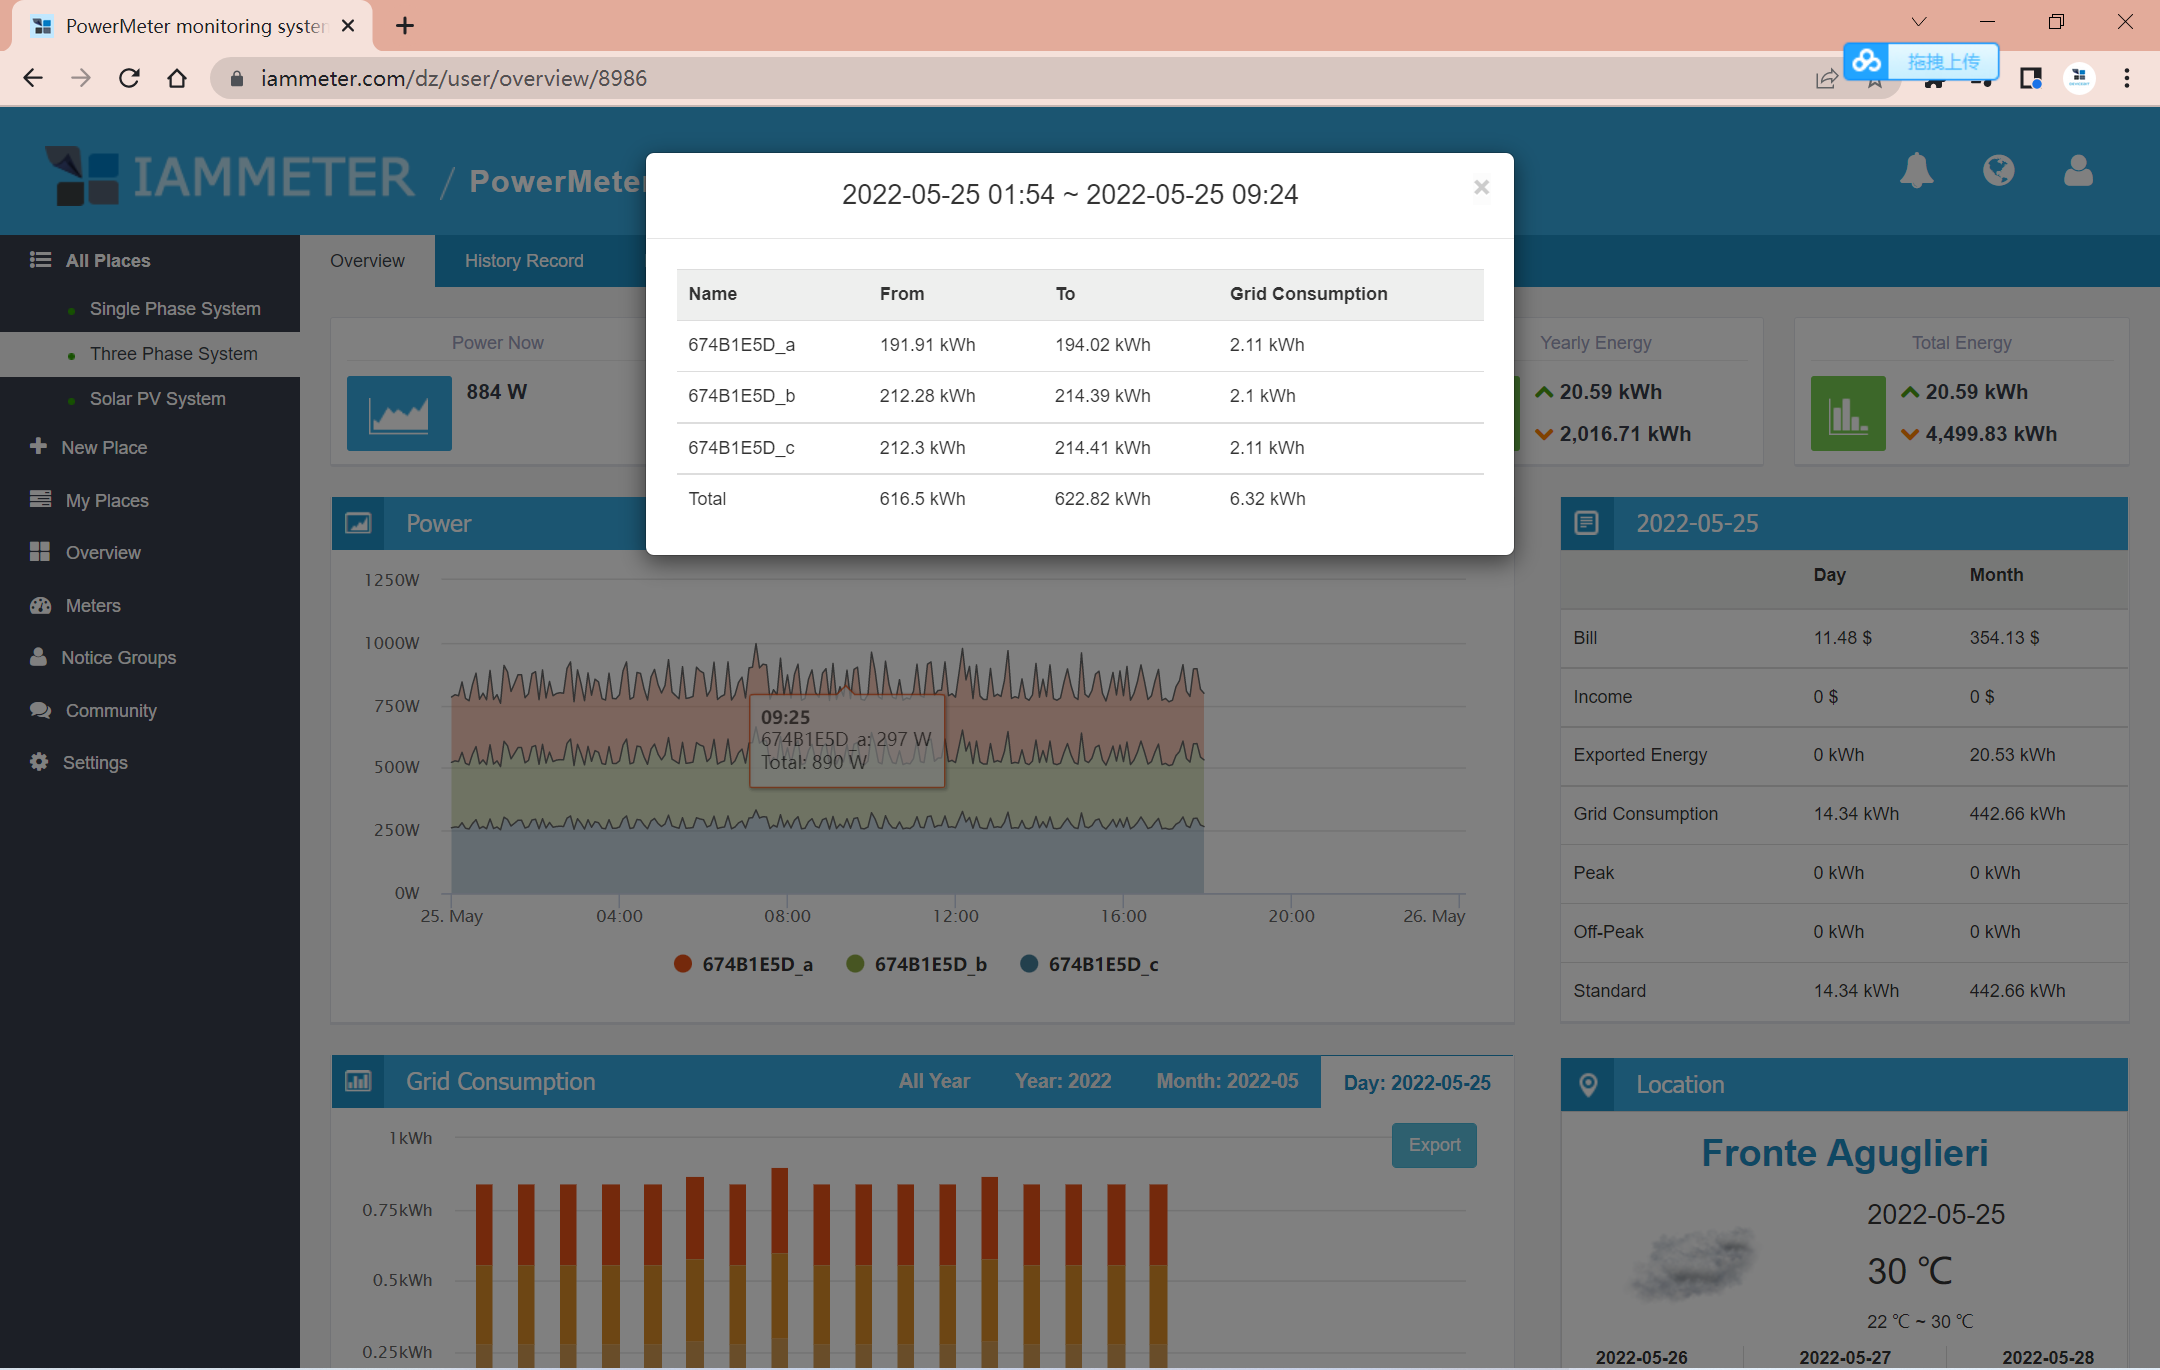
In the latest version of the app, you can zoom the power chart directly, and analyze the kWh (grid consumption, solar yield energy, exported to grid energy) difference in the time range you selected.
This is the app version of this feature https://imeter.club/topic/233
- Enable Enable "Screen auto-rotate"
- Turn the phone in landscape mode in the overview page, it will enter this function. If you do not like the landscape mode, you can also enter this function by clicking the right-up icon in portrait mode.
- Select the time range, and click the "kwh" icon.
Latest firmware upgrading of the Wi-Fi energy meter
1 Stable version that supports Modbus/TCP. How to use the modbus tcp function in Wi-Fi energy meter of IAMMETER
You can request the data from Modbus/TCP each second.
2 Add a run mode of "stand-alone"
3 change the function of the API that changes the upload interval
4 Bugfix of the previous version.
More details ,please refer to https://imeter.club/topic/11
Analyze the energy difference within the selected time interval from the power chart
This is the new function after the latest upgrading of IAMMETER-cloud.
Video show: https://www.youtube.com/watch?v=O1P0CxKV21I
More details https://imeter.club/topic/233
1 press "Alt" key
2 select the time interval in the power chart.
")
")
")
")